content


Key Takeaways
Feature tracking prioritizes product decisions using engagement signals to identify high-value capabilities and eliminate unused functionality early
Adoption measurement reveals user depth frequency and breadth across wallet activity enabling teams to detect friction and improve onboarding clarity
Wallet analytics connects engagement signals to revenue outcomes and retention trends helping teams validate product market fit and growth assumptions
In Web3, it’s not enough to attract users — you need users who engage with the features you’ve built. Feature adoption analytics tracks what features users interact with, how often they use them, and where they drop off. You can double down on what works, fix what doesn’t, and grow retention like a pro.
In this guide, we’ll cover:
What feature usage means (and what it isn’t)
Why tracking matters for product and growth teams
How to calculate and analyze usage effectively
Common pitfalls and how to avoid them
How Web3 teams can level up with wallet analytics
What is Feature Adoption?
Feature adoption measures how often users interact with a specific feature over a given period. It’s not just raw clicks. Effective tracking captures depth (how heavily a feature is used), breadth (how many users adopt it), and frequency (how often users return to it).
Example:
In a Web3 form builder like Formo, a “file upload” feature might be tracked to know:
What percentage of active users upload files
How often do they use this feature weekly or monthly
Whether usage trends are increasing or declining
Why Feature Adoption Matters
Tracking feature adoption isn’t just a “nice-to-have” — it’s the difference between building what you think users want and what they use. Here’s why top product and marketing teams obsess over it:
1. Prioritize Development with Data
No more building in the dark. Feature usage data shows you exactly where users are spending their time. If a feature is getting high engagement, double down with improvements or expansions. If something’s gathering dust, it might be time to sunset it and free up resources for features that matter.
2. Improve Onboarding & UX
A powerful feature with low adoption is a red flag. The problem might not be the feature itself — it could be that users don’t know it exists, can’t find it, or don’t understand how to use it. Tracking usage helps you spot these gaps so you can tweak onboarding flows, in-app prompts, or UI placement to make discovery effortless.
3. Boost Retention & Revenue
Retention is driven by habit-forming features — the ones users come back for, again and again. When you know which features keep people engaged, you can focus on optimizing them, turning occasional users into loyal (and paying) customers.
4. Measure Product-Market Fit Signals
Consistent, growing usage of your core features is one of the strongest signals that you’re hitting product-market fit. It means you’re solving a real problem for your users — and they’re coming back because they can’t live without your solution.
When to Track Feature Adoption
Feature adoption data is always useful — but there are moments when it’s mission-critical:
1. Launching a New Feature
You’ve shipped something fresh. Now it’s time to measure adoption in real numbers with product analytics, not just vibes. Tracking usage lets you see how quickly (or slowly) users discover it, what actions they take, and whether it’s delivering value.
2. Testing UX Changes
Small tweaks in layout, navigation, or labeling can make or break discoverability. By monitoring feature usage before and after a UX change, you can see if your update improved engagement — or accidentally buried a feature people loved.
3. Tracking Core Features Linked to Retention or Monetization
Some features are make-or-break for your business model. If they’re tied to subscription renewals, in-app purchases, or repeat wallet activity, you’ll want a constant pulse on how often they’re used and by whom.
4. Shaping Your Development Roadmap
When your dev sprint planning starts, feature usage tells you where to invest. Build on what’s working, optimize what’s underperforming, and drop what’s a distraction.
5. In Web3: Onchain Campaign Launches
In the decentralized world, adoption isn’t just clicks — it’s wallet actions. During onchain campaigns, tracking feature usage shows you exactly which features drive wallet connects, token claims, or other onchain activity that lead to conversions.
How to Calculate Feature Adoption Rate
The simplest formula is:
Example:
If 500 of your 2,000 active users uploaded a file this month:
Feature Adoption Rate = (500 ÷ 2000) × 100 = 25%
You can also track:
Usage frequency — average number of times a feature is used per active user
Time-to-first-use — how long it takes for a new user to try it
How to Analyze Feature Adoption
Great feature usage analysis goes beyond counting clicks. It blends hard numbers with human context so you understand why users behave the way they do. Here’s how to break it down:
1. Segment Your Users
Don’t just look at overall adoption — slice the data by user type. In Web3, that might mean:
New vs. returning wallets to see how quickly new users discover key features.
High-value vs. low-value users to understand which features your top spenders or most active wallets rely on.
2. Compare Across Features
Rank your features by adoption rate and engagement time. This helps surface your “power features” — the ones that keep people engaged longest — and highlight features that need extra visibility or improvement.
3. Monitor Trends Over Time
Track usage patterns weekly or monthly. Spikes could signal a successful campaign or seasonal demand. Dips might point to UX friction or feature fatigue. Plateaus? That’s your cue to refresh or innovate.
4. Tie Usage to Outcomes
Engagement is nice, but impact is better. The best features aren’t just popular — they directly influence conversions, onchain transactions, or retention. Always link usage metrics back to the business or growth goals they serve.
Common Pitfalls to Avoid in Feature Usage Tracking
Tracking feature usage can unlock powerful insights — but only if you do it right. Here are the traps even seasoned teams fall into:
1. Chasing Vanity Metrics
Raw numbers can be deceiving. A feature might have thousands of clicks, but if those interactions don’t lead to meaningful outcomes — like transactions, conversions, or retention — the value is questionable. Always pair volume with context.
2. Ignoring Drop-Off
Adoption is just the starting line. If most users try a feature once and never return, that’s a warning sign. You need to track repeat usage and understand why people disengage — whether it’s poor UX, unclear value, or lack of need.
3. Lacking Benchmarks
Without a baseline, it’s hard to know if a feature’s performance is good or bad. Compare against your own historical data, competitor benchmarks, or industry averages to keep your analysis grounded.
4. Tracking Without Acting
Metrics without follow-through are just numbers in a dashboard. The real power comes when insights drive action — whether that’s improving UX, changing onboarding flows, or reallocating development resources.
Beyond Clicks: Proxy & Complementary Metrics
Counting clicks is a start — but it’s only part of the story. To truly understand a feature’s impact, you need supporting metrics that reveal its role in driving meaningful outcomes. Pair feature usage with:
1. Funnel Conversion Rates
See if users who interact with a feature are more likely to complete key actions — from signing up to making an onchain transaction.
2. Session Length & Depth
A feature that increases session time or encourages users to explore deeper into your product is likely to boost engagement and stickiness.
3. Retention Cohorts
Track whether users who use a specific feature are more likely to come back week after week or month after month.
4. Revenue per Wallet (RPW)
In Web3, monetization is often tied directly to wallet activity. Pairing RPW with feature usage helps you see which features drive your highest-value transactions.
When you combine feature usage with these complementary metrics, you get a 360° view of whether a feature is just “nice” or truly business-critical.
How to Track Adoption with Formo
Tracking feature adoption doesn’t have to be complicated — with the right setup, you can start collecting valuable insights in minutes. Here’s how to get started.
1. Create an Account
First, sign up for a web3 product analytics platform like Formo. This will be your dashboard for capturing and visualizing feature usage data.
2. Install the Tracking SDK
Add the SDK script between the <head> tags of your site. This one line of code enables event tracking across your product.
Tip: In Web3, you’ll also want an analytics tool that can track onchain actions alongside Web2 events — that's exactly what Formo does. Otherwise, you will miss out on a significant part of the user's journey.
3. Verify Your Installation
Make sure your site is passing data correctly to Formo. This ensures your events are being recorded without loss or delay.
4. Define Custom Events
Use the SDK tracking functions in Formo to mark the actions you want to track. The Formo SDK offers an easy-to-use event collection library that allows you to track custom events in your dapp. Ensure high quality, structured data with Formo.
Custom events can capture a broad range of actions, such as clicking a button or completing a purchase.Additional information about the event can be included in the properties field. For example, for a Purchase Completed event, you may want to include the product ids of the purchased products.
When naming events, Formo recommends establishing a consistent naming convention that uses:
Consistent formatting: Event names are case sensitive.
A consistent syntax: Adopt nouns and past tense verbs like
Swap ReviewedandOrder Submitted. A standard of[Noun] + [Past-Tense Verb]ensures all your events are consistent.A consistent actor: Does
Message Sentmean that the user sent a message or that you sent a message to the user? If all your events are named in a way that reflects the user’s perspective, the meaning is clear immediately.
This allows everyone including you 6 months from now to instantly understand the meaning of an event.
Start tracking custom events with the Web SDK to get started. Custom events works with Wallet Intelligence and Funnels to give you a complete picture of each user’s journey.
5. Visualize Your Data
Create charts and custom dashboards to track adoption, engagement, and trends over time. This helps you quickly identify standout features and underperformers at a glance.
In Web3, every click, tap, or signature tells a story. Feature usage tracking is your compass for understanding what resonates, what needs improvement, and where to steer your product next. The clearer your view of how users (wallets) engage, the faster you can iterate, onboard, and grow—without wasting time on what doesn’t work.
Formo’s web3 analytics tool let you see which features are driving retention, revenue, and community impact — so your product roadmap isn’t guesswork, it’s a data-backed strategy.
Read more:
Follow Formo on LinkedIn and Twitter, and join our community to learn how you can turbocharge growth onchain!
FAQs
1. What is feature adoption analytics?
Feature adoption or product adoption analytics is the practice of tracking how frequently and deeply users engage with specific product features. It goes beyond simple click counts to measure three key dimensions:
Depth: How heavily a feature is used
Breadth: How many users adopt it
Frequency: How often users return to it
In Web3, feature usage analytics also captures wallet activity, such as smart contract interactions, token claims, and other onchain behaviors, providing a more complete picture of user engagement.
2. Why should Web3 and SaaS teams track feature adoption?
Tracking feature adoption ensures that teams build features users actually engage with, not just features they think users want. Key benefits include:
Prioritizing development efforts based on real engagement
Identifying and fixing onboarding gaps
Highlighting high-retention and habit-forming features
Validating product-market fit
For Web3 teams, it also uncovers which features drive valuable onchain actions, such as wallet connections, token transactions, or governance participation.
3. How is the feature adoption rate calculated?
The basic formula is: Number of unique users who used the feature / total active users
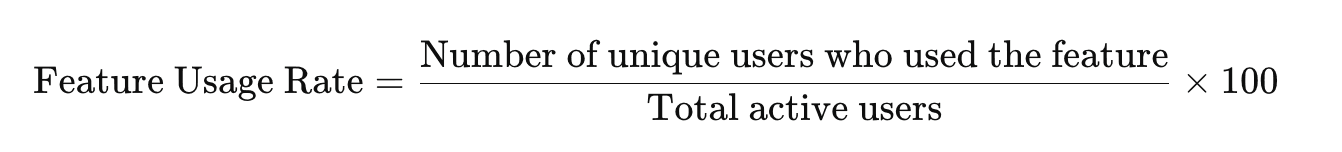
Example: If 500 out of 2,000 active users uploaded a file this month, the feature usage rate is 25%.
Additional metrics to track include:
Usage frequency: How often a user engages with a feature
Time-to-first-use: How long it takes for a new user to try a feature
Repeat usage rate: How many users return to the feature
4. What are common mistakes when tracking feature adoption?
Even experienced teams can fall into traps, including:
Chasing vanity metrics: Counting clicks without context can be misleading
Ignoring repeat usage: One-time engagement doesn’t indicate long-term value
Lacking benchmarks: Without baselines, it’s hard to judge performance
Tracking without acting: Data is only useful if it informs UX, onboarding, or product decisions
In Web3, a frequent mistake is ignoring wallet-based segmentation, which can hide important adoption patterns among high-value or active wallets.
5. How can teams go beyond clicks to measure feature impact?
Clicks alone don’t show the real value of a feature. To measure business impact, pair feature usage metrics with complementary indicators:
Funnel conversion rates: Does using the feature lead to key actions?
Retention cohorts: Are users coming back regularly after engaging with the feature?
Revenue Per Wallet (RPW): How does feature usage correlate with monetization?
Wallet score segmentation: Which high-value wallets rely on the feature most?
Using this multi-metric approach provides a 360° view of a feature’s true value, enabling product and marketing teams to make data-driven decisions.