

Key Takeaways
Web3 Cohort Analysis groups users by behavior or acquisition time to reveal retention patterns.
Retention is critical; many Web3 projects face steep user drop-offs after initial engagement.
Acquisition cohorts show when users churn; behavioral cohorts explain why.
Identifying sticky features and churn timing helps improve onboarding and user experience.
Iterative testing with cohort data optimizes product and marketing strategies for long-term growth.
Acquiring users is only the first step. Retaining them is what truly drives long-term success. The most successful Web3 projects focus on meaningful retention metrics like repeat activity, user engagement, and time between actions, rather than vanity metrics. Web3 cohort analysis helps by grouping users based on shared attributes or behaviors to identify engaged segments, uncover retention gaps, and generate actionable product insights. In this guide, we’ll explore how cohort analysis can transform your Web3 retention strategy and fuel sustainable growth.

Web3 Cohort Analysis reveals how different user groups interact with a platform over time
What is Web3 Cohort Analysis?
Web3 Cohort Analysis groups users based on dapps used, wallet holdings, or campaigns. This segmentation reveals how different user groups interact with a platform over time, critical for optimizing Web3 user acquisition, retention, and lifetime value (LTV). Cohort analysis is invaluable for understanding user behavior and measuring project success.
Web3 Cohort Analysis Example: Ethereum
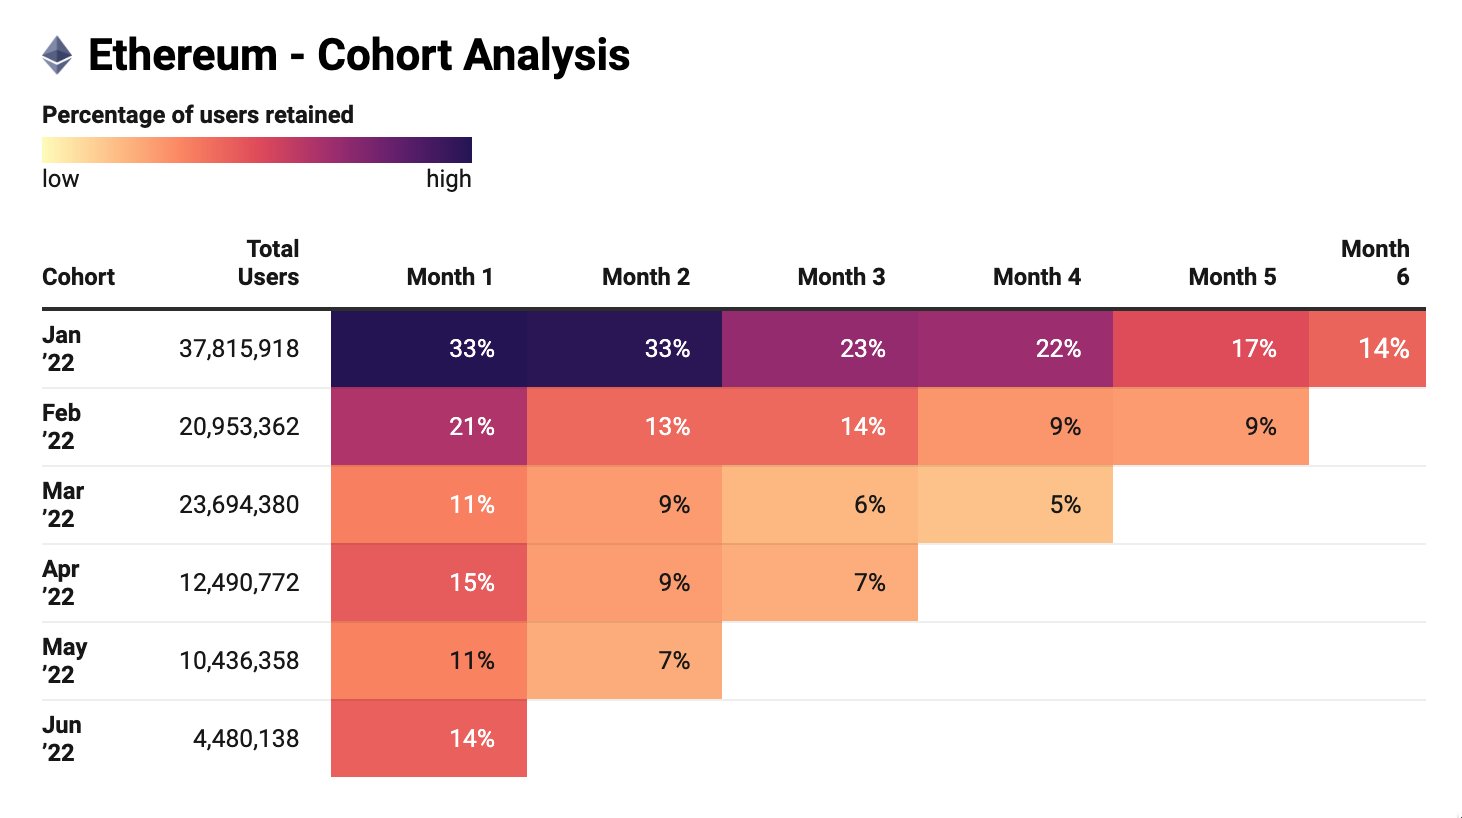
Track the wallet cohort of users active on Ethereum and observe their retention. Over the next 6 months, we uncovered the following insights:
The January cohort included the largest group, with 37M wallets. However, by June, only 4.5M wallets remained active.
Cohort analysis in research shows that despite the drop-off, 22% of the January cohort remained active by Month 4, marking the highest retention rate.
An example of the wallet cohort of users active on Ethereum
Why Web3 Cohort Analysis Matters
User retention remains a major challenge for decentralized applications (dApps). Many projects struggle to sustain meaningful engagement over time, even during market surges. Web3 Cohort analysis provides actionable insights into onchain user behavior, helping you:
Enhance user retention: By analyzing ongoing engagement, Web3 teams identify factors contributing to user drop-off and develop strategies to improve monetization and retention rates.
Uncover behavioral insights: Understanding onchain activities empowers more accurate, behavior-driven marketing, such as analyzing how users respond to market changes or platform features.
Improve performance measurement: Evaluating marketing campaigns by cohort performance provides data-driven decisions to inform future initiatives.
Using cohort analysis, you refine marketing and product strategies, enhance the customer experience, and optimize resource allocation.
Types of Cohort Analysis
Broadly, cohorts are divided into two key categories:
Acquisition cohorts
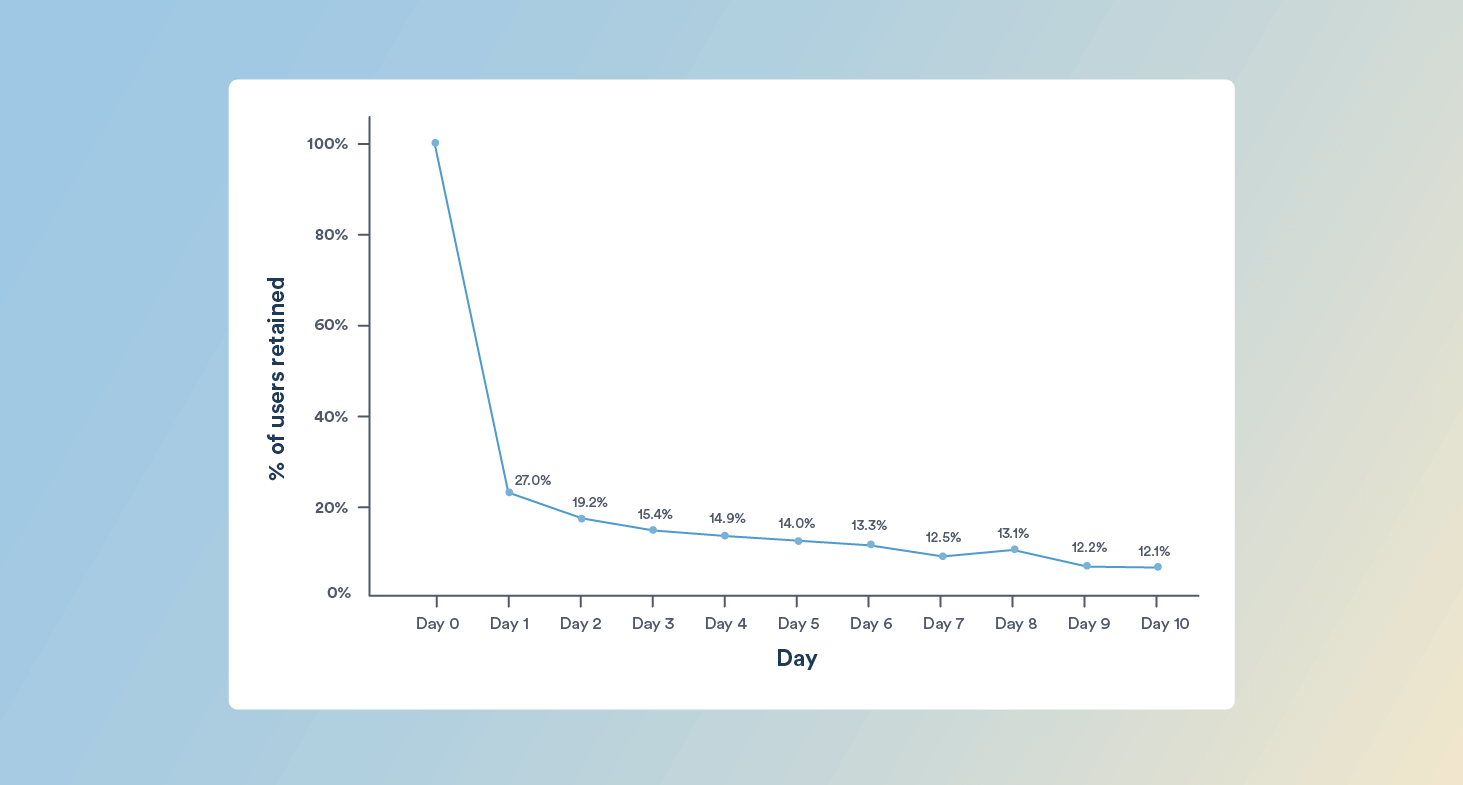
Acquisition cohorts group users by when they signed up (e.g., day, week, or month). This analysis helps track retention and churn rates, revealing how long users stay engaged from their starting point.
For example, the below retention curve shows a 75% drop-off after Day 1, with further declines to 12% by Day 5 and 11% by Day 10. This pattern often signals that users aren’t quickly accessing the app’s core value, emphasizing the need for a better onboarding experience.
An example of acquisition cohorts
While acquisition cohorts highlight “when” churn happens, we need behavioral cohorts to understand “why”.
Behavioral cohorts
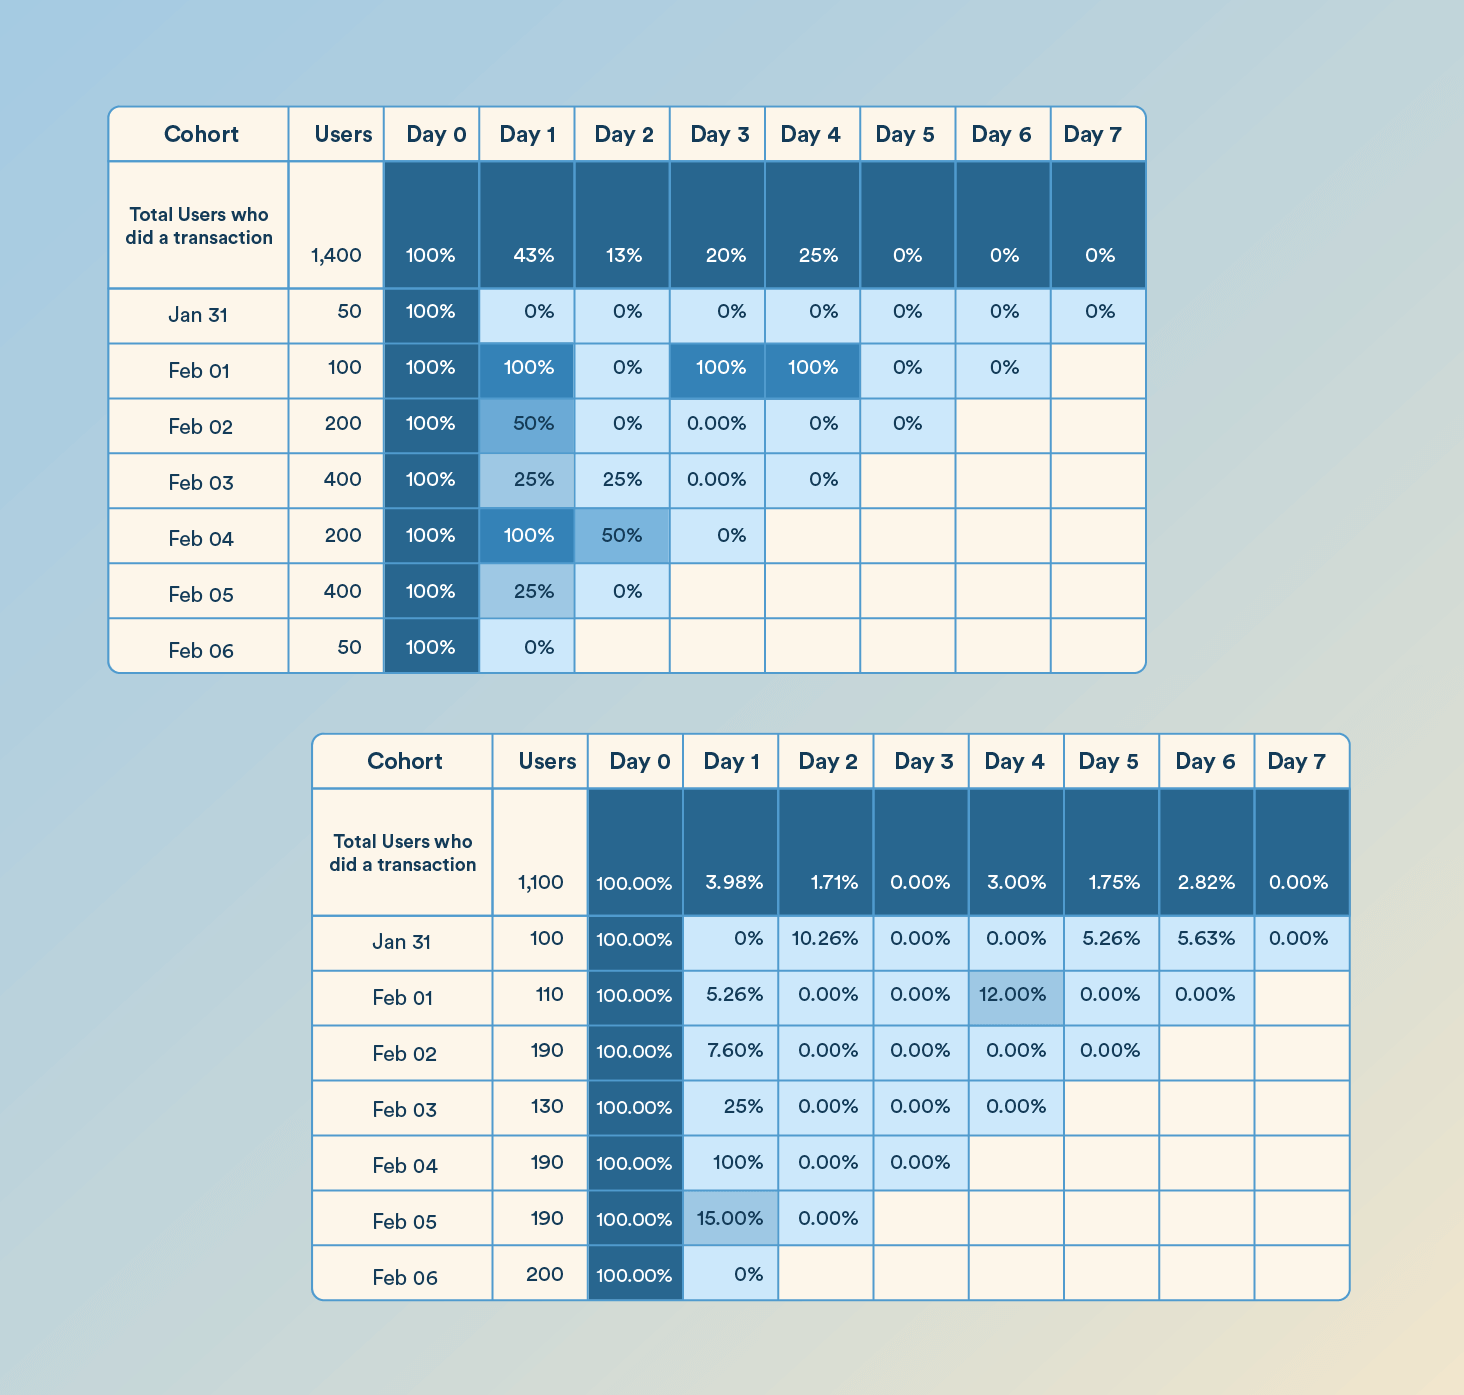
Marketers or analysts categorize behavioral cohorts by specific actions or behaviors, such as app installs, launches, or transactions. For example, analysts examine users who made purchases within three days to understand how their behaviors enhance engagement and retention.
An example of how to track behavioral cohorts
From this group of behaviors, we observe that:
Transaction Cohort: Among 1,400 users, 43% made transactions on Day 1, and by Day 4, retention spiked to 25% after dropping to 13% on Day 2.
Abandoned Cart Cohort: Of 1,110 users, only 3.98% re-engaged on Day 1, declining to 1.71% by Day 2 and minimally improving on Day 4. These users may need targeted offers or reminders soon after cart abandonment.
Comparing these cohorts helps identify key engagement moments and strategies, such as retargeting campaigns or personalized incentives, to reduce churn.
4 steps to conducting a cohort analysis
Here are 4 basic steps to conduct your Web3 cohort analysis
1. Track Churn Timing
Identify when users churn by analyzing acquisition cohorts over time. This helps pinpoint specific drop-off moments and understand the causes.
When you observe the timeline for different user cohorts, you tend to start seeing patterns such as:
When do users stop engaging actively with your product?
Which features did they stop or never start using?
Which types(s) of users cancel their subscriptions and when?
An example of tracking churn timing
2. Identify Sticky Features
Look for major drop-offs in your cohort data and ask what happened on those days. Instead of broad engagement patterns, focus on specific features, user flows, or UX elements that may affect retention.
3. Compare Behavioral Cohorts
It’s often a mix of features and behaviors that drive retention issues. Compare behavioral cohorts to uncover these layers. Cohorts help you track changes in user behavior after signup and understand why. The main goal is to find inflection points and understand if users engage enough with features during onboarding.
4. Iterate and Test
Cohort analysis is not the final goal - it's a step that feeds into A/B testing. The aim is to identify a connection between metrics like churn, upgrades, drop-offs, onboarding completion, or other user engagement indicators and specific variables in your product. Once you establish a relationship between core metrics and a variable, you can modify it and test to see if conditions improve. If there’s no change, discard your initial assumption, return to step three, and continue experimenting.
Web3 Cohort Analysis Example
Let’s start with the retention rate of networks in 2024, based on the user cohort from the beginning of this year.
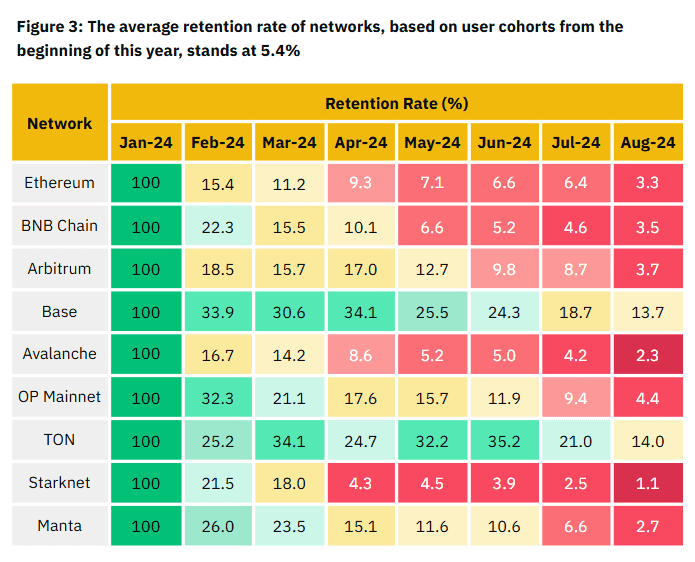
An example of the retention rate of networks in 2024
Starknet demonstrates crypto’s retention struggles, as its user retention dropped sharply from 18% in March to just 4.3% by later months. Their airdrop campaign’s end likely caused this decline, showing how speculative incentives fail to sustain long-term engagement.
In contrast, networks such as Base and The Open Network (TON) show stronger retention, thanks to their focus on building robust consumer ecosystems and a solid product-market fit.
In this cohort, we see two key areas for improving crypto adoption:
Use Cases: Develop compelling consumer crypto products that generate intrinsic demand and foster engagement.
Distribution: Leverage Web2 channels to introduce Web3 products to non-crypto-native audiences, accelerating the transition from Web2 to Web3.
Web3 Cohort Analysis Tools
Web3 Cohort Analysis is a cutting-edge tool to understand Web3 user behavior and improve retention by identifying when and why users drop off. provides the data-driven clarity needed to make informed decisions to enhance customer churn analysis, identify sticky features, and improve your onboarding process. Acquisition cohorts (e.g., grouped by signup month) reveal when users tend to churn, while behavioral cohorts (e.g., segmented by transactions or cart abandonment) shed light on why engagement drops occur.
With a strong data foundation in place, your onchain product and growth teams can improve their data-driven decision-making.
Formo stands out in this space by offering a Web3-native analytics platform that directly integrates on-chain data, enabling teams to harness cohort analysis on wallets for growth, performance tracking, and higher-quality user segmentation, making it a powerful ally for any Web3 project focused on retention and scalable, data-driven decision-making.
Read more:
Follow us on LinkedIn and X to learn how Formo turbocharges growth for leading teams across web3!
FAQs
1. How often should Web3 projects perform cohort analysis?
Web3 teams should run cohort analysis monthly or quarterly to track changes in user behavior, measure the impact of new features, marketing campaigns, or token incentives, and adjust retention strategies. Frequent analysis helps identify trends early and improves decision-making for growth.
2. What are the best tools for performing Web3 cohort analysis?
The best tools for Web3 cohort analysis are analytics platforms that combine onchain and offchain data. Popular options include:
Formo: purpose-built for product analytics and wallet intelligence
Dune: for custom SQL queries and dashboards
Nansen: for wallet tracking and smart money insights
These tools let teams monitor wallet activity, user sessions, and smart contract interactions across time-based cohorts.
3. How is cohort analysis different from general user analytics?
General analytics provide aggregate metrics like total transactions or daily active wallets. Cohort analysis, on the other hand, groups users by shared characteristics (such as signup date, first transaction, or feature adoption) and tracks them over time. This reveals retention rates, engagement trends, and churn risks that aggregated data often hides.
4. Can cohort analysis help detect fraudulent or inactive wallets?
Yes. Cohort analysis can uncover abnormal activity patterns, such as sudden drop-offs, repeated low-value transactions, or identical behavior across many wallets. These signals may indicate bot traffic, airdrop farming, or dormant accounts. Identifying these patterns ensures more accurate analytics and sharper focus on real, engaged users.
5. What metrics should Web3 teams track in cohort analysis?
Key Web3 cohort analysis metrics include:
Retention rate – how many wallets remain active after a set time (e.g., 7, 30, 90 days)
Transaction frequency – how often users interact with your protocol or dApp
Feature adoption rate – which apps, products, or features users engage with
Churn rate – when users stop transacting or interacting altogether
Revenue, TVL, Fees – wallet activity tied to revenue-generating transactions onchain
Tracking these metrics helps Web3 teams understand user journeys, identify power users, and optimize growth and retention strategies.
6. How does cohort analysis support token incentive design in Web3?
Cohort analysis allows teams to measure the long-term impact of airdrops, staking rewards, liquidity mining, or referral incentives. By grouping users who received specific incentives and comparing them to control cohorts, teams can evaluate whether those incentives led to sustained engagement or just short-term speculation. This prevents wasted token spend and helps design more effective growth loops.
7. Can cohort analysis reveal product-market fit for a Web3 project?
Yes. If cohorts show improving retention and engagement over time, it’s a strong signal that the product is finding market fit. For example, when newer cohorts outperform older ones in terms of wallet activity, transaction size, or governance participation, it indicates that the product is resonating with its audience. Conversely, consistently weak retention across cohorts may signal the need to refine core product value or GTM strategy.
8. How can Web3 teams combine cohort analysis with community insights?
Numbers alone don’t tell the full story. By pairing cohort data with community feedback from Discord, Telegram, governance forums, or surveys, teams can contextualize why certain cohorts behave differently. For example, a drop in retention may align with negative sentiment after a protocol upgrade, or improved adoption may follow a community-led campaign. This hybrid approach blends quantitative onchain signals with qualitative community insights for a holistic growth strategy.


