

Key Takeaways
Web3 ≠ Web2: Go beyond surface-level metrics—track wallets, onchain behavior, and ecosystem activity.
Wallet connections ≠ real growth: True activation happens when users mint, stake, or transact.
Engagement is onchain: Active wallets, transaction frequency, and usage intensity reflect real traction.
Retention is critical: Analyze returning users, identify at-risk wallets, and track re-engagement.
Revenue isn't just TVL: Use ARPU, CLV, and fee contribution to understand and optimize monetization.
To grow a Web3 product, you need more than just user acquisition—you need a complete view of how users engage, interact, and return over time. Unlike Web2, where metrics focus on centralized events like clicks or signups, Web3 introduces a new paradigm. Here, success is measured through wallet-level activity, onchain interactions, and protocol-level engagement.
In this guide, we’ll break down the key Web3 product growth metrics across acquisition, activation, engagement, retention, and revenue. You’ll learn how these metrics differ from Web2, why they matter, and how to apply them using real-world insights and tools like Formo to optimize your dApp’s performance.
Web3 product growth metrics measure onchain activity, wallet balances, and ecosystem mindshare
Why Are Web3 Product Metrics Important?
As a Web3 product team, it’s essential to understand what drives meaningful user behavior—what gets users to engage, return, and generate value. While Web2 growth metrics like conversion rates, customer acquisition costs (CAC), and customer lifetime value (CLTV) still have relevance, they don’t fully capture the pseudonymous, wallet-based nature of onchain apps in Web3.
Web3 product growth metrics measure user engagement and growth based on onchain activity, wallet balances, and ecosystem mindshare, providing a comprehensive view of your product’s overall health. It offers more accurate insights into meaningful impact by focusing on wallet activity and onchain conversions. By monitoring the right metrics early, teams can enhance onboarding, iterate more quickly, and develop products that users truly want.

Web3 product metrics help you iterate faster, optimize acquisition, and build a Web3 app that users truly want.
Web2 vs. Web3 Product Growth Metrics
Product growth metrics such as daily active users (DAUs), retention rates, and click-through rates are critical performance indicators. In Web3 product development, you need to monitor who is using your app and how they interact with similar protocols. Instead of focusing solely on sign-up numbers, you’ll look at Web3 product growth metrics such as wallet connections and onchain activity. Indicators such as Total Value Locked (TVL) and active wallets provide a better picture of user engagement than page views and visitor numbers.
Data-driven onchain apps should track the full user journey, including wallet and onchain activity.
Web2 metrics emphasize pageviews, visitors, and sessions. Web3 metrics track wallet connections, onchain activity, and meaningful transactions. Metrics like Total Value Locked (TVL), active wallets, and protocol fees provide stronger signals of user trust and ecosystem engagement.
Metric Type | Web2 Example | Web3 Equivalent |
Acquisition | Signups | Wallet Connections |
Activation | First Purchase | First Transaction (Mint / Stake / Swap) |
Engagement | Pageviews / DAU | Onchain Txns / Daily Active Wallets |
Retention | Session Returns | Returning Wallets |
Revenue | ARPU / CLTV | Protocol Fees, TVL, ARPU |
Key Web3 Product Metrics to Track
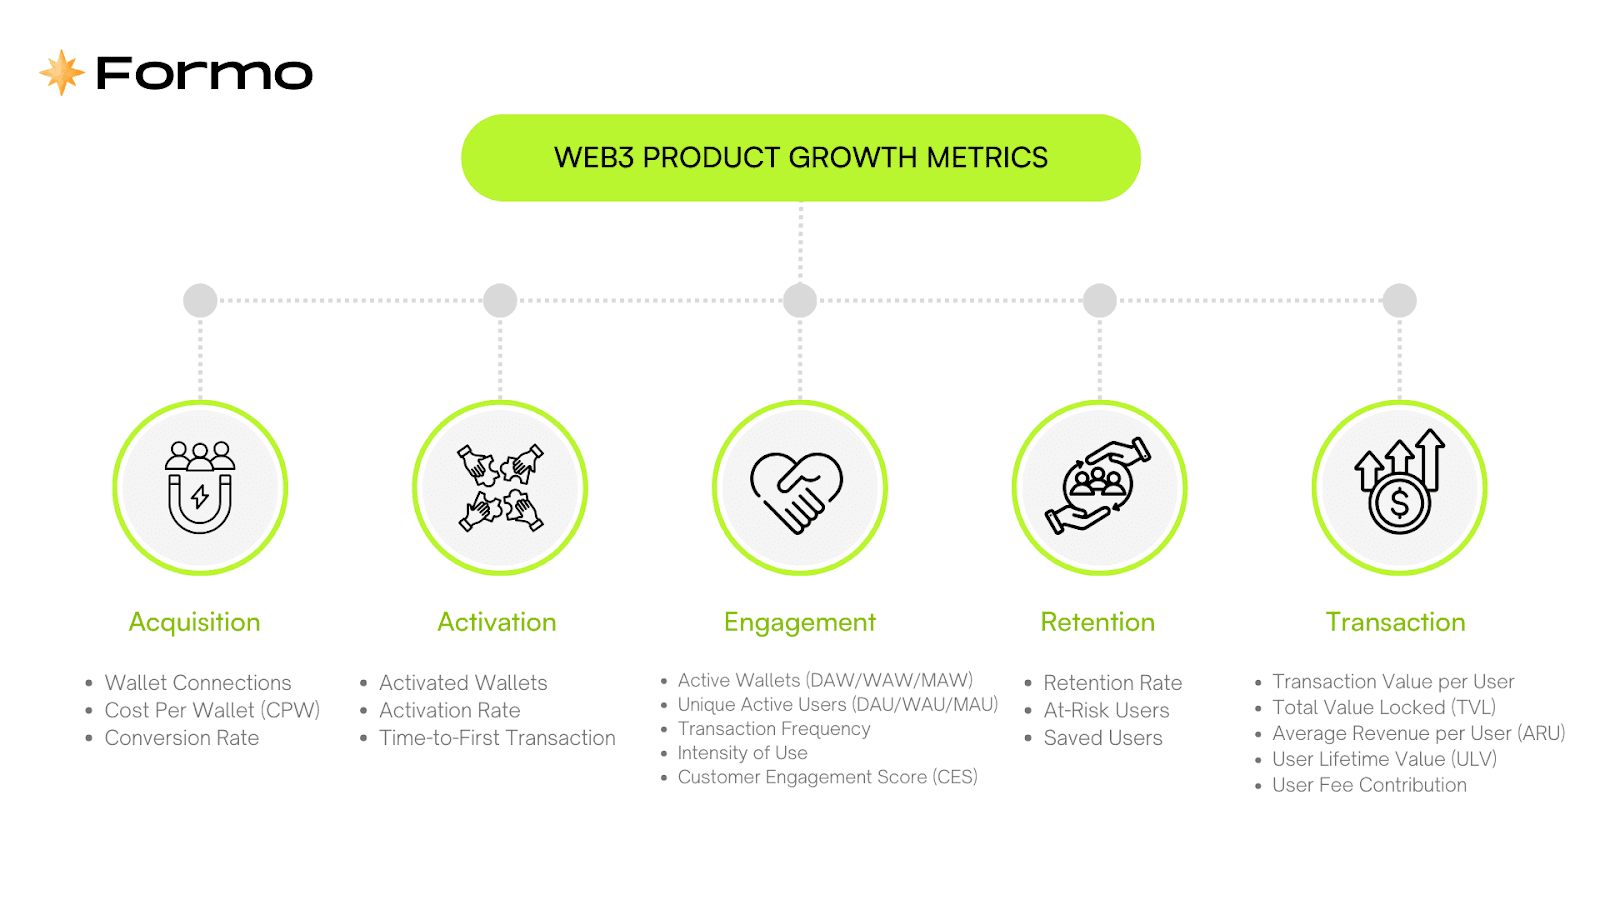
Key onchain product growth metrics
Onchain Acquisition Metrics
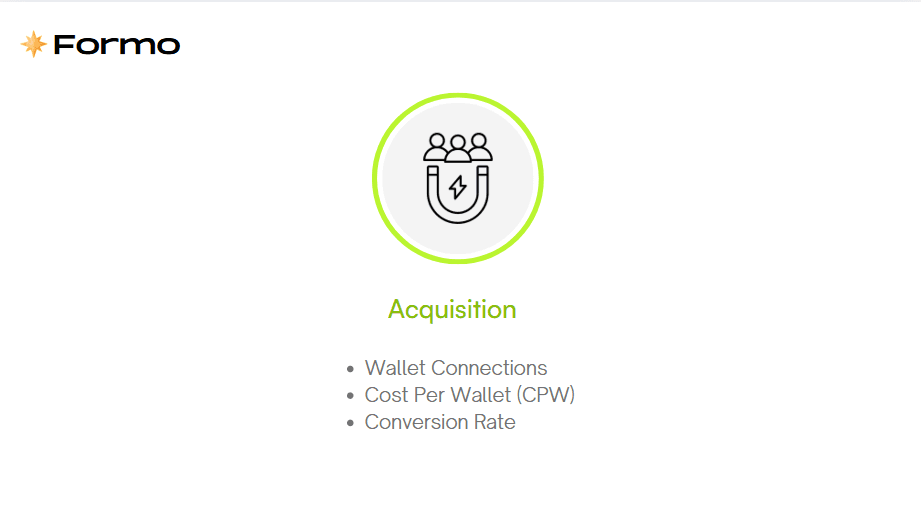
Key Web3 acquisition metrics
Wallet Connections: The first sign of user interest. Tracking wallet connections helps you gauge how many users are exploring your dApp. Optimize onboarding and support multiple wallet types to improve conversion.
Cost Per Wallet (CPW): It’s crucial to measure how much you’re spending to acquire each wallet connection. You can assess the efficiency of different acquisition channels (e.g., ads, content marketing, referrals) with this information.
Conversion Rate: Measures how many users connect their wallets or sign up for your service. A high conversion rate typically means an easy, smooth onboarding experience. Focus on reducing friction in the process to improve conversions.
Onchain Activation Metrics
Key onchain activation metrics
Activated Wallets: Track wallets that perform meaningful actions like staking, minting, or swapping. This helps you identify your most engaged users and connect feature adoption to user activation.
Activation Rate: The percentage of new wallets that complete at least one meaningful action post-onboarding. Low rates may signal UX, technical, or messaging issues.
Time-to-First Transaction: The time it takes a user to complete their first transaction. Reducing the time-to-value can significantly improve early engagement on your app.
Onchain Engagement Metrics
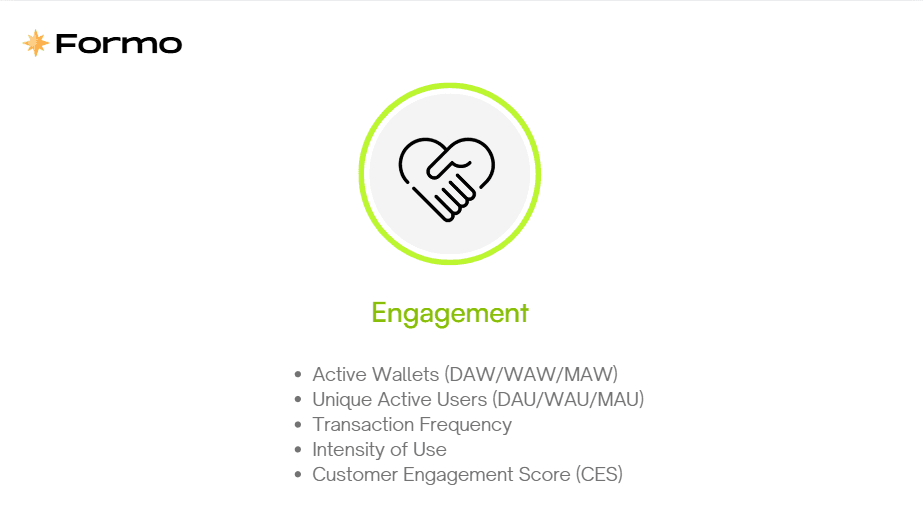
Key onchain engagement metrics
Active Wallets (DAW/WAW/MAW): Track daily, weekly, or monthly active wallets to measure user engagement. Incentives, push notifications, and regular product updates can increase these metrics.
Unique Active Users (DAU/WAU/MAU): Avoid inflated numbers by identifying how many unique wallets are interacting with your product.
Transaction Frequency: Measures how often users engage with your app. How often do users interact with your dApp? A high frequency implies strong product utility and PMF.
Intensity of Use: Look at volume, size, and frequency of user interactions—e.g., large stakes or recurring governance participation. Larger volumes are a signal of deep user engagement.
Customer Engagement Score (CES): CES assign points to actions (e.g., swap = 2 pts, mint = 3 pts) to quantify user engagement. CES scores help with user segmentation and personalization by identifying which actions lead to activation.
Onchain Retention Metrics
Key onchain retention metrics
Retention Rate: Measures the percentage of active wallets that continue engaging with your platform over time (daily, weekly, or monthly). High retention is a sign of a valuable dapp. If retention is decreasing, consider implementing loyalty programs or regularly updating your product based on user feedback to reignite interest.
At-Risk Users: Identifies users who have been inactive for a specified period (e.g., 30-60 days). Monitoring this helps you proactively address potential churn. If many users stop engaging, it may signal a need for feature improvements or better user experience (UX).
Saved Users: Tracks users who were once at risk but have returned to active status. This reveals the impact of recent product updates or feature releases. By understanding what drives re-engagement, you can optimize retention strategies.
Revenue Metrics
Key onchain revenue metrics
Transaction Value per User: This metric measures the average value of transactions per user, typically denominated in wei. It helps assess the spending behavior of your user base. High transaction values indicate trust in your platform, but if not correlated with retention, it suggests acquiring high spenders who don’t stick around.
Total Value Locked (TVL): TVL is a key metric, especially in DeFi platforms. It represents the total assets locked in a protocol’s smart contracts. Higher TVL indicates greater user trust and confidence. Tracking TVL fluctuations helps assess the health and growth potential of your project.
Average Revenue per User (ARPU): ARPU measures the average revenue generated per active user. It’s important to evaluate the success of your monetization strategy. If ARPU is lower than expected, it suggests that your pricing or in-app offerings need adjustment. Tracking ARPU by user segments helps you target valuable demographics.
Customer Lifetime Value (CLV): CLV estimates the total revenue a user generates over their entire engagement with your platform. This metric helps you gauge whether your acquisition costs are justified and assess long-term growth potential.
User Fee Contribution: This metric measures how much revenue users generate through protocol fees. It’s critical for projects relying on transaction-based income. Understanding which users contribute the most fees helps make strategic decisions about features and fee structures, ensuring they’re balanced to maximize engagement and revenue.
Final Thoughts
Web3 product growth metrics don’t replace traditional metrics—but they do augment them. Choosing the right onchain growth metrics depends on your product and growth stage. What matters most is tracking quantifiable metrics that help you understand and optimize the user journey.
Formo provides critical onchain growth metrics that empower you to turbocharge your dapp. Formo’s Web3 Product Analytics helps you track, analyze, and visualize Web3 product growth metrics in real time, transforming raw data into actionable insights.
Follow us on LinkedIn and X for more onchain growth insights!
Read more:
FAQs
1. What makes Web3 product metrics different from Web2 metrics?
Traditional Web2 analytics focus on pageviews, clicks, and website traffic. In contrast, Web3 product metrics and onchain user analytics track in-app wallet behavior and blockchain transactions. Web3 growth analytics tracking offers a transparent and verifiable view of user engagement, monetization, and retention across dApps, protocols, and blockchains using public onchain data.
2. Why isn’t wallet connection alone a reliable growth metric?
A wallet connection is just the first step—it shows interest but not meaningful commitment. In Web3 growth analytics, to measure meaningful growth, you need to track real conversions, such as onchain transactions. Onchain behaviors such as swaps and deposits reflect product activation and real engagement. By tracking real onchain activity, you move from vanity metrics to real user activation.
3. How do I know if users are truly engaged with my Web3 product?
Monitor metrics like active wallets (daily/weekly/monthly), transaction volume, time between transactions, and Customer Engagement Score (CES). These indicators reveal both the frequency and depth of interactions, helping you assess user stickiness and product value.
To evaluate Web3 user engagement, track:
Active wallets (daily, weekly, monthly)
Revenue, Volume, TVL, and Fee growth over time
Transaction frequency and retention rates
Time between transactions (stickiness indicator)
Customer Engagement Score (CES)
These Web3 engagement metrics go beyond surface-level activity to show the depth of user interaction, helping you identify power users and product-market fit.
4. How can I identify users who are likely to churn?
Watch for inactivity windows. Wallets with no meaningful interaction in the past 30–60 days are considered at-risk users. Tracking resurrected users—those who return after inactivity—also helps identify what features, messages, or incentives successfully re-engage users.
Onchain churn analysis relies on detecting inactivity. Wallets without significant interaction for 30–60 days are flagged as at-risk users. Tracking resurrected wallets—users who return after dormancy—helps reveal which Web3 retention strategies, such as incentives, product updates, or community campaigns, drive successful reactivation.
5. What’s the most effective way to measure revenue in Web3?
Use metrics like ARPU (Average Revenue Per User) and CLV (Customer Lifetime Value). Revenue measurement in Web3 product analytics requires tracking ARPU (Average Revenue Per User) and CLV (Customer Lifetime Value). These onchain monetization metrics provide insights into long-term sustainability, showing whether your dApp or protocol generates repeat value instead of one-time transactions.
6. What metrics matter for Layer-1 and Layer-2 blockchain growth?
For L1/L2 ecosystems, growth isn’t just user numbers—it’s about both monthly active addresses (MAAs) and developer activity (i.e. apps built on top). If MAAs rise but the number of applications remains static, growth may be superficial or hype-driven. True ecosystem growth reflects both higher usage and an expanding app/building community.
7. Which protocol-level metrics best reflect DeFi or infrastructure health?
At the protocol level (like DeFi platforms or L1s), key metrics include:
Total Value Locked (TVL) or Total Value Secured (TVS) — aggregate asset value held in smart contracts
User count and transaction volume
Cost of capital relative to active TVL (i.e. how much subsidy is being paid vs. fees earned)
These metrics show economic demand, product trust, and whether incentives are generating sustainable value—not just temporary spikes.
8. Are traditional SaaS metrics like CAC, LTV, and ARPU still relevant in Web3?
Yes—but they need thoughtful adaptation.
CAC (Customer Acquisition Cost): split between blended CAC (total paid + organic cost per wallet) and paid CAC (explicit marketing spend per wallet acquired). In crypto, this accounts for incentives like airdrops or rewards that artificially inflate growth metrics if not tracked separately
LTV (Lifetime Value): may measure a single wallet’s contribution to TVL, recurring revenue, or assets deposited
ARPU (Average Revenue per User): often calculated per active address, similar to Web2 apps but based on onchain transaction or fee data
Analyzing the LTV:CAC ratio, especially after incentives are no longer in effect, reveals whether product adoption continues organically or declines once rewards are no longer available.
9. How does the crypto-specific growth funnel differ from Web2?
Although the funnel stages (awareness → acquisition → activation → retention → monetization) still apply, crypto introduces unique touchpoints:
Awareness/lead gen: reach still matters, but onchain signals like wallet interest (e.g. wallet downloads or token claims) often outweigh impressions
Acquisition: distribution happens via onchain mechanics—airdrop eligibility, wallet quests, token partnerships—not email lists or ads
Activation: measured via onchain behaviors like staking, minting, swapping, or governance actions
Retention: tracked via active address frequency and resurrected wallets
These metrics are layered with token incentives, community dynamics, and open governance structures that play roles Web2 funnels lack.
10. Should product teams track qualitative signals alongside metrics?
Absolutely. Quantitative dashboards are critical—but qualitative feedback can be early indicators of true product-market fit. Things like community sentiment (forum chatter, memes, hackathon interest), IRL event engagement, or early adopters’ behavior often reveal traction before numbers catch up. The best strategies combine data insights with community intuition to guide optimizations and ecosystem decisions.


