

Key Takeaways:
Web3 product metrics are critical for making data-driven decisions from launch onward.
Track new and active wallets to understand acquisition and retention trends.
Segment users into at-risk, saved, and super users to strengthen product-market fit.
Key metrics include Retention Rate, CLV, CAC, Activation Rate, CES, Satisfaction Score, and NPS.
Tools like Formo make it easy to track, analyze, and engage Web3 users effectively.
Tracking the right Web3 product metrics from day one can make or break your project’s success. These metrics go beyond basic page views or social media impressions—offering real, onchain insights that guide product, marketing, and growth decisions. In this guide, we’ll explore 10 critical metrics every Web3 team should track to measure adoption, improve retention, and accelerate growth.
Web3 Product Metrics helps data-driven product teams track adoption, identify product-market fit, and make data-driven decisions.
Web3 Product Metrics
Web3 product metrics help you track adoption, evaluate product-market fit, and make data-driven decisions. By measuring onchain behaviors alongside offchain activity, you can identify which acquisition channels work, which users are most valuable, and how to optimize for growth.
While every project will have unique KPIs, the following 10 metrics form the foundation for effective Web3 growth tracking.
1. New Wallets (Signups)
New Wallets represent users who had their very first onchain interaction with your project during a given period. This “first interaction” marks the point where an audience officially becomes a user.
To better understand this conversion process, track the steps leading up to it:
Page views of your conversion point (e.g., sign-up, mint, or purchase page)
Wallet connections before an onchain action is taken
By monitoring wallet connections, you can gauge your web3 conversion rate. For example, if 1,000 views result in 25 wallet connections (2.5%) and 3 onchain transactions (12% of connected wallets), those 3 users enter your New Wallets category.
2. Active Wallets
Wallets consistently active with your project in a set timeframe—commonly Monthly Active Wallets (MAW). A relatively flat active wallet trend line is a positive sign, beacuse it means you’ve found your core set of users. Analyzing the habits of your core users can provide insights for further growing and retaining your user base.
To uncover deeper insights, segment your active wallets into super users, high-value users, and competitive users. Tools such as Formo make creating segments easy.
3. At-Risk Wallets & Saved Wallets
At-risk wallets: No activity for 30–60 days. May indicate poor retention or targeting non-ideal users. This Web3 Product Metric can indicate
Lack of product-market fit
Lack of features to retain users
Targeting non-ideal users
Saved wallets: Users who were at-risk but became active again—often due to new features or re-engagement campaigns. This can signal:
New or improved features that meet user needs
Improved product-market fit
Effective communications to reach existing users
4. Retention Rate
The retention rate measures the percentage of users who continue using a product over a given period. It reflects how well your product resonates with users and keeps them engaged. A high retention rate signals strong product-market fit, unlocks opportunities for more efficient marketing, and provides a steady stream of valuable user feedback to guide future improvements.
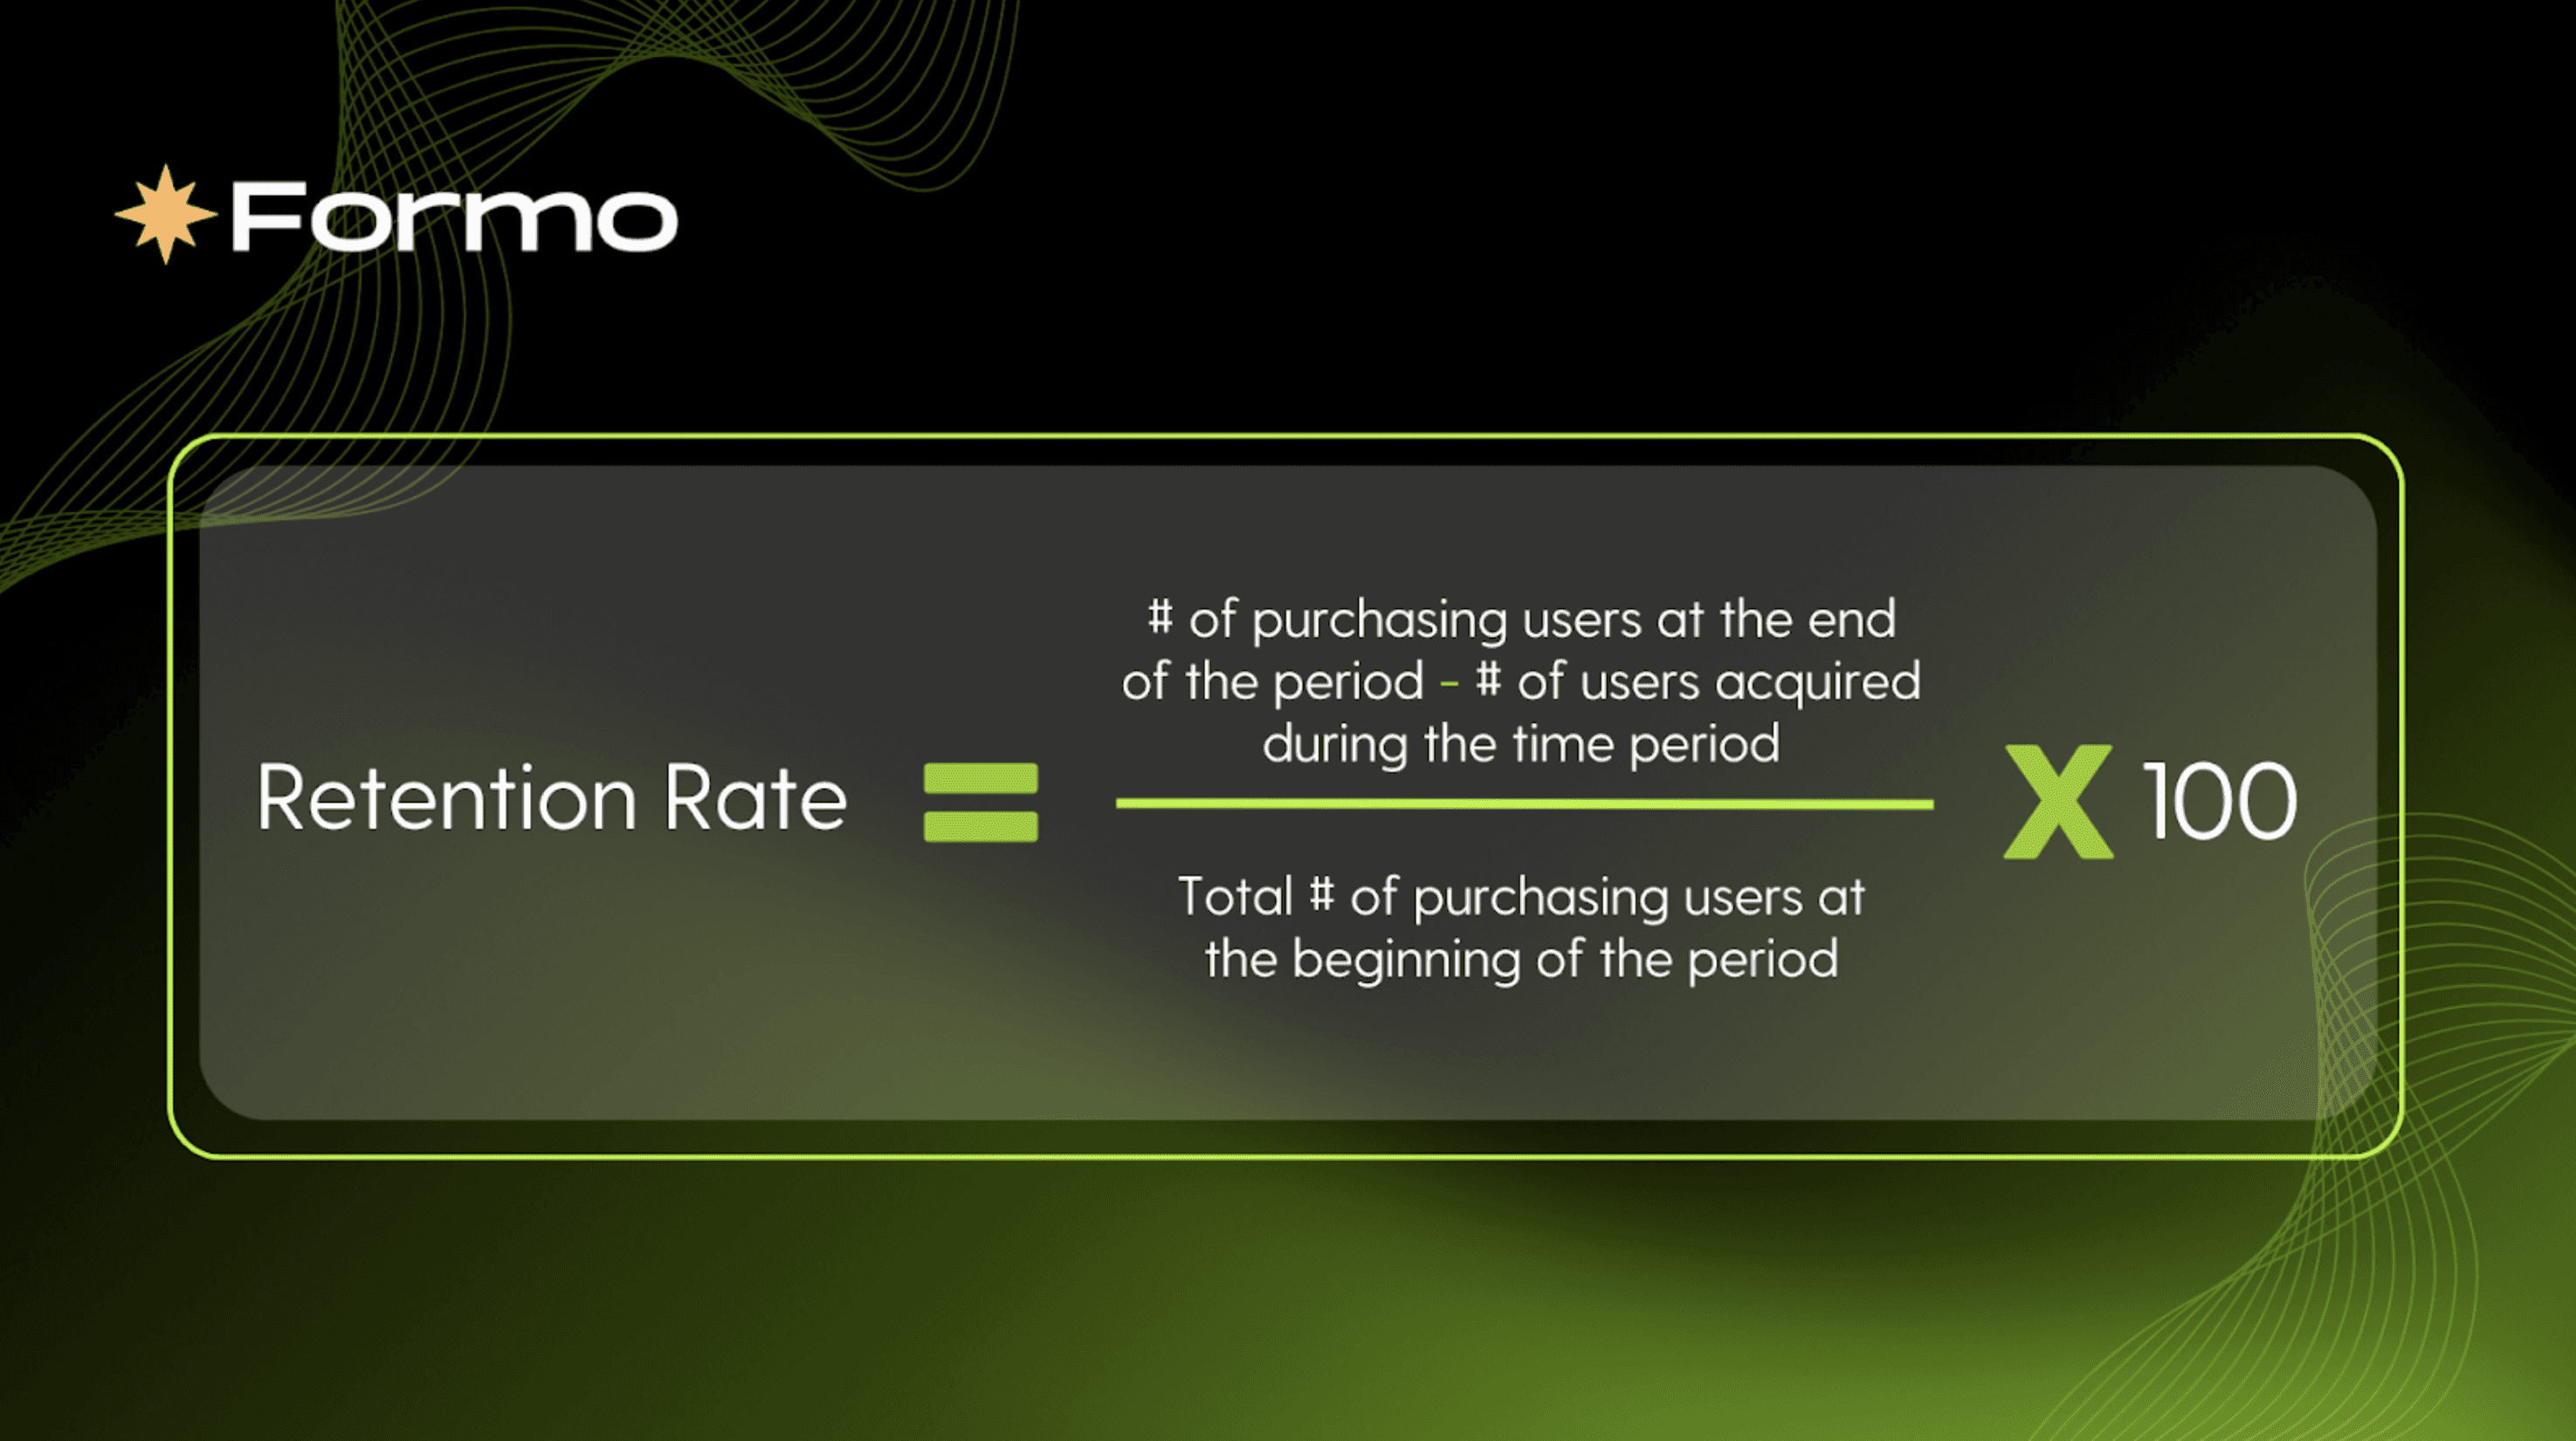
Retention rate formula
To calculate it, divide the number of purchasing users at the end of a period by the total number at the beginning, then multiply the result by 100. For example, 750 out of 3,000 is a retention rate of 25%.
5. Customer Lifetime Value
Calculating the lifetime value (LTV) of web3 users varies by project; however, a proven starting point is the Customer Lifetime Value (CLV) formula, widely used in web2. This framework provides a reliable baseline that can be adapted to onchain behavior and revenue models.

Customer lifetime value formula
To calculate customer lifetime, divide your total user lifetime by your total number of users. This CLV calculation indicates the health of your product and service. If your CLV is greater than your CAC, you’re trending in the right direction.
6. Customer Acquisition Cost
Customer Acquisition Cost (CAC) is the cost of acquiring a new user. It’s a key metric for evaluating the efficiency of your acquisition efforts, especially when launching a new product.
In web3, airdrops often function as a native form of CAC. To get meaningful insights, CAC should be analyzed on a per-channel basis. Common acquisition channels for new products include:
Paid advertising
Content marketing
Referral programs
Airdrops

Customer acquisition cost formula
To calculate CAC, divide the total sales and marketing spend by the number of new users acquired in a given period. For example, if $10,000 was spent to acquire 200 new users, the CAC would be $50 per user.
7. Activation Rate
Activation rate is the percentage of users who successfully activate and engage with your product. It measures the effectiveness of go-to-market strategy and the likelihood of reaching the “aha” moment.
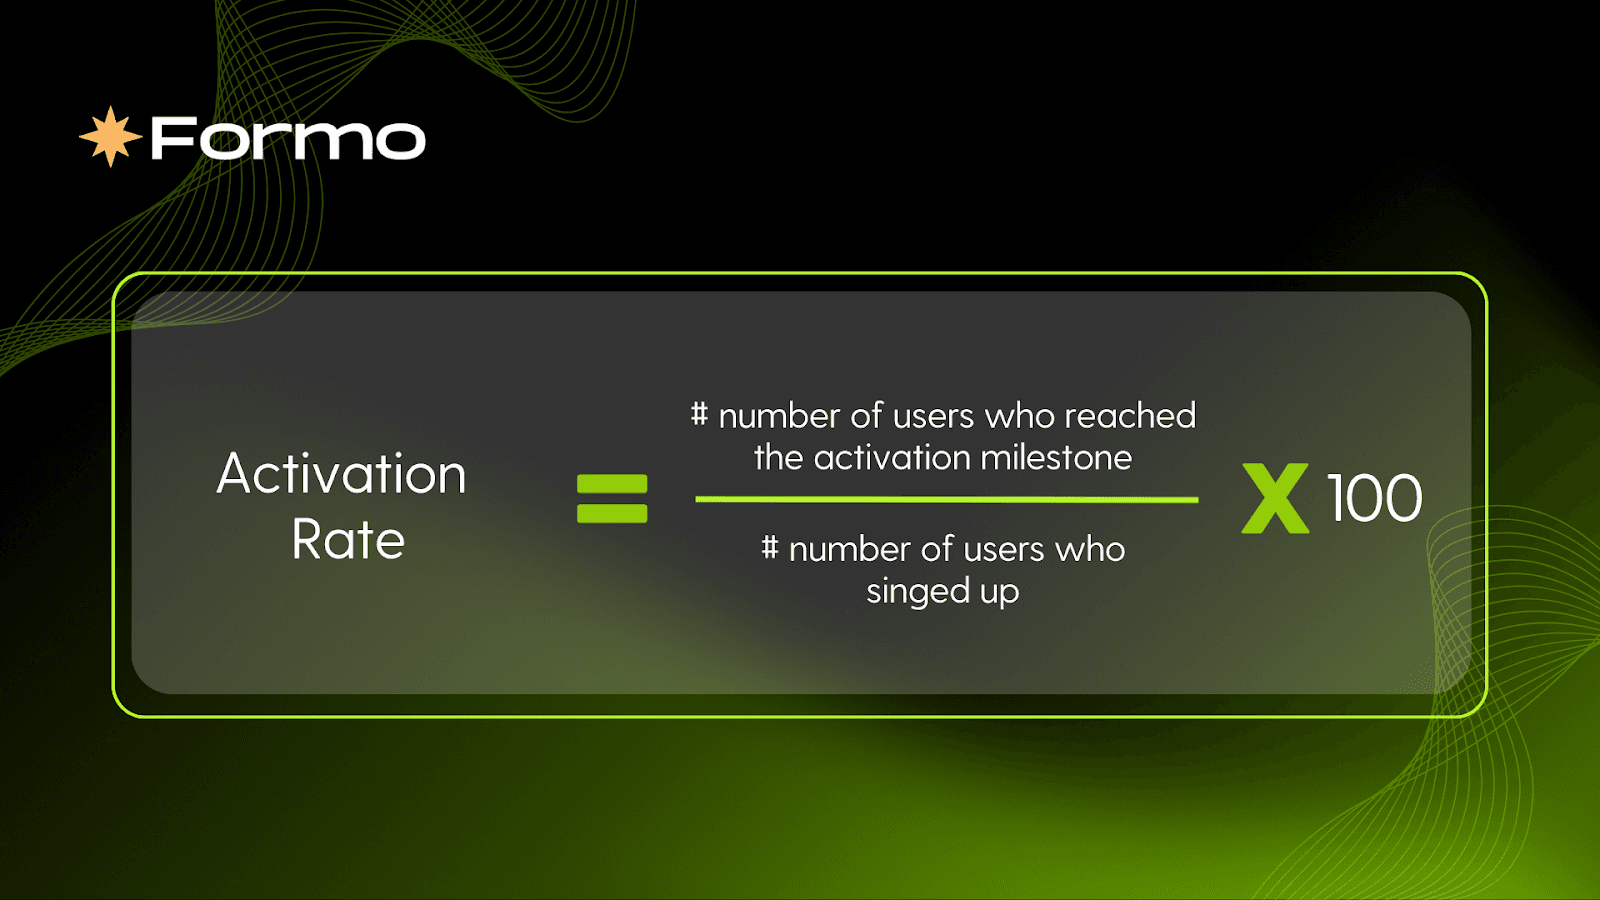
Activation rate formula
It is calculated by dividing activated users by sign-ups and multiplying by 100. For example, if 600 out of 1000 signups are activated, the rate is (600/1000) * 100 = 60%.
Brands typically aim for an activation rate of over 40%. Tracking activation helps improve go-to-market strategy and optimize the activation funnel.
8. Customer Engagement Score
A weighted score based on how often and how deeply users interact with your product.

Customer Engagement Score (CES) formula
To calculate Customer Engagement Score (CES), multiply the impact and frequency of each user event within a given period, then sum these values to get the total score. Tracking CES helps you measure engagement more effectively, uncover opportunities for product expansion, and ultimately drive revenue growth.
9. Satisfaction Score
The Satisfaction Score measures how satisfied users are with your product. It evaluates whether you’re meeting their expectations.
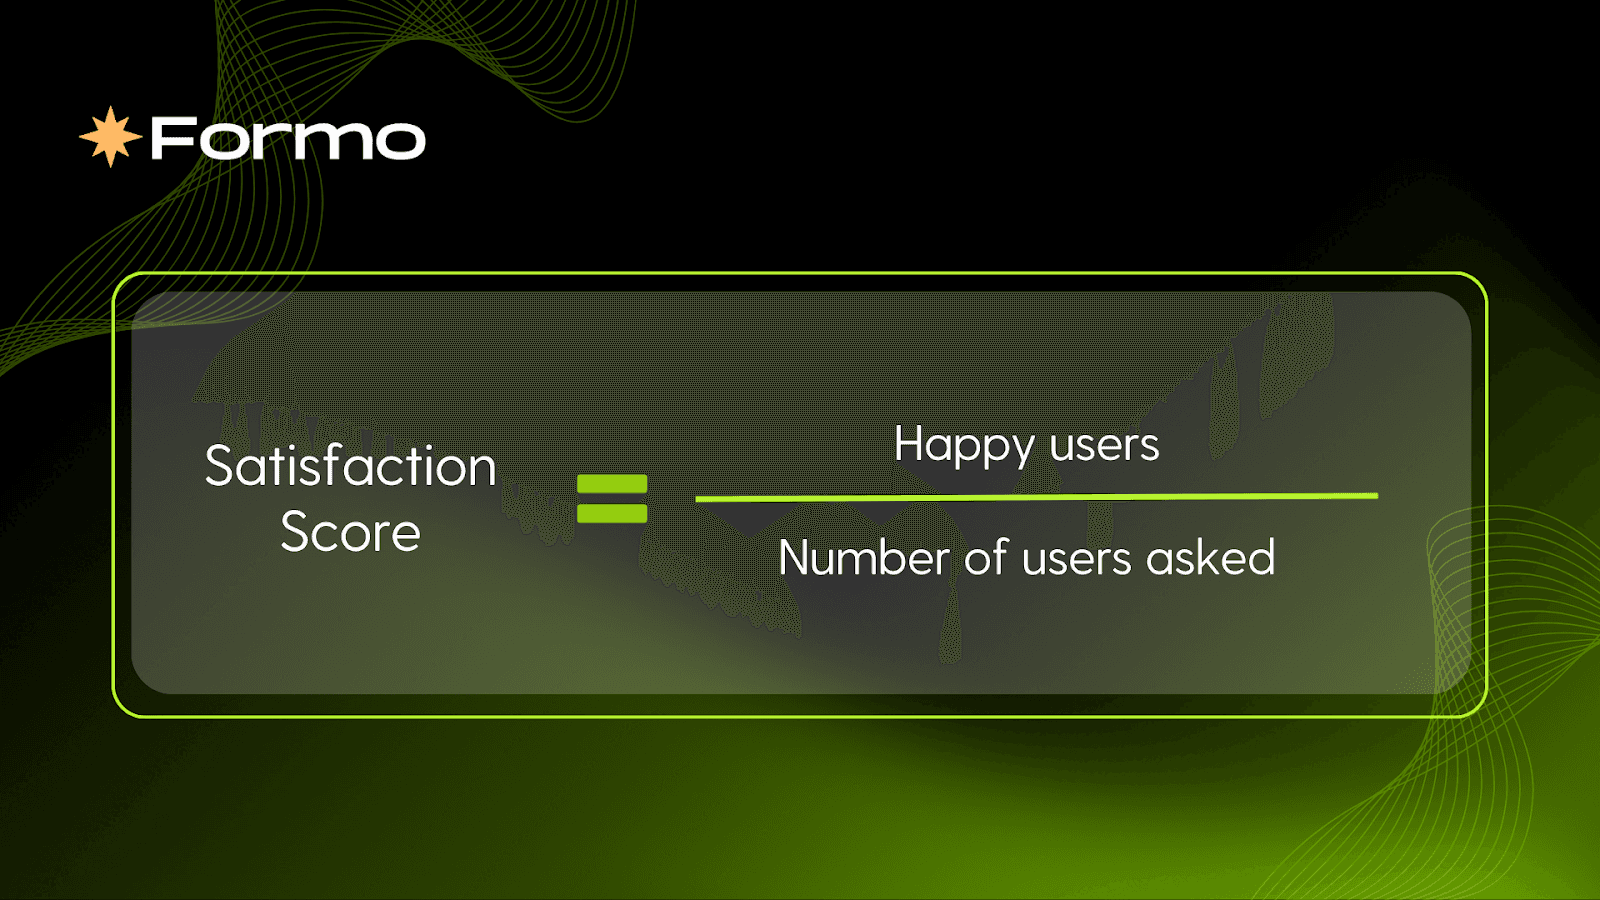
Satisfaction score formula
To calculate it, send out a survey asking users to rate their satisfaction on a scale of 1-10. Divide the number of satisfied (8+) users by the total number of users surveyed.
10. Net Promoter Score
NPS measures how likely users are to recommend your product. It indicates the potential for word-of-mouth advertising.
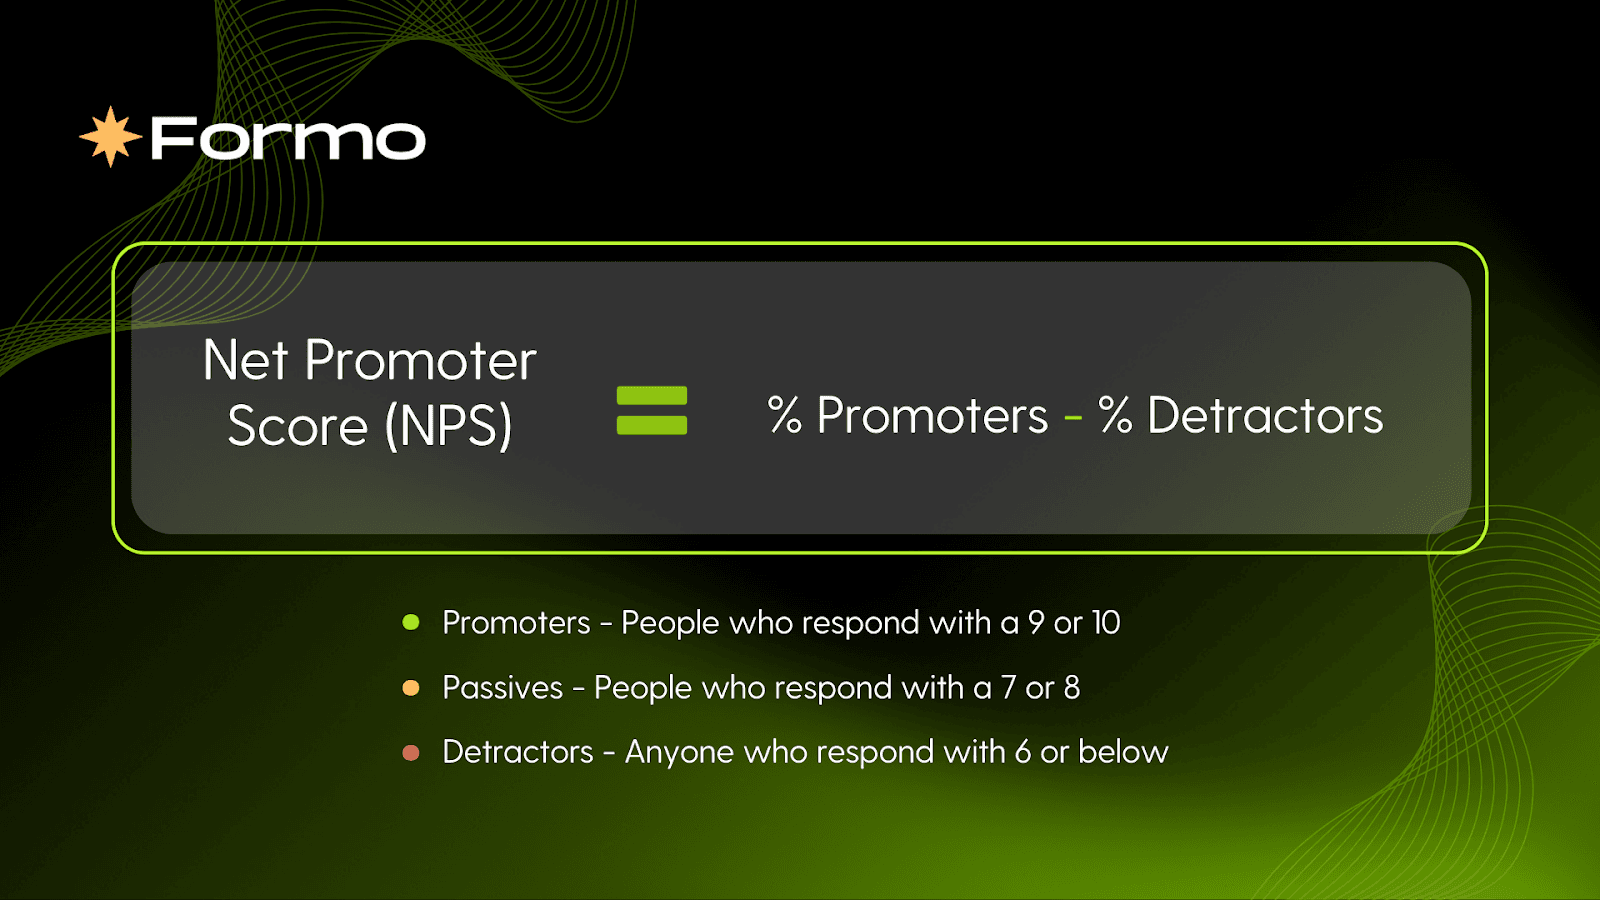
Net promoter score formula
Calculate NPS by subtracting the percentage of detractors (6 or less) from promoters (9-10). For example, if 59% are promoters and 17% are detractors, NPS is 59-17 = 42.
Aim for an NPS of around 40. Include follow-up questions in your NPS survey to identify areas of improvement.
Accelerate product growth with Formo
Formo is the data platform for onchain apps.Formo makes analytics easy. Get the best of web, product, and onchain analytics on one versatile platform. Accelerate your growth loop with unified analytics and attribution.
Designed for marketing and product teams, it helps you to track in-app behaviour, segment onchain users, and measure user satisfaction with surveys. Formo equips you with the tools you need to make data-driven decisions.
The success of an onchain app depends on monitoring and improving your product metrics. Start using product metrics to refine your product roadmap and go-to-market strategy.
Learn more:
Follow us on LinkedIn and X for more onchain growth insights.
FAQs
1. Why are Web3 product metrics important?
Web3 product metrics provide essential insights into user behavior, growth trends, and product performance. Tracking these metrics enables teams to make informed, data-driven decisions that improve user experience, optimize marketing strategies, and accelerate product adoption in a decentralized ecosystem.
2. What is the difference between new wallets and active wallets?
New wallets refer to users who interact with your project’s blockchain for the first time, marking their initial onchain engagement.
Active wallets are users who regularly engage with your product within a specific time frame (commonly 30 days). Tracking both helps you understand user acquisition and ongoing engagement levels.
3. How do I calculate Customer Acquisition Cost (CAC) in Web3?
To calculate CAC, divide your total sales and marketing expenses by the number of new users acquired during that period. In Web3, native acquisition methods such as token airdrops, rewards, or incentives should also be included in your total spend to accurately reflect acquisition costs.
4. What is a good Net Promoter Score (NPS) for Web3 products?
An NPS score of around 40 or higher is generally considered strong in the Web3 industry. This shows that a significant portion of your users are likely to recommend your product to others, which can drive organic growth and enhance user loyalty.
5. How can I measure user satisfaction in Web3?
User satisfaction can be measured through surveys asking users to rate their experience on a scale of 1 to 10. Calculating the percentage of users who rate your product 8 or higher provides a clear Satisfaction Score. Leveraging Web3-native form builders like Formo streamlines survey creation for onchain users, enabling you to collect actionable feedback efficiently.
6. What role does TVL (Total Value Locked) play in Web3 product metrics?
TVL represents the total amount of assets deposited into your protocol or application, usually expressed in USD. It is a critical metric for DeFi and other Web3 projects because it reflects user trust, liquidity, and overall adoption. Monitoring changes in TVL helps teams evaluate growth momentum, assess product-market fit, and compare traction against competitors in the ecosystem.
7. How do I measure stickiness in a Web3 product?
Stickiness is typically calculated by dividing Daily Active Wallets (DAW) by Monthly Active Wallets (MAW). A higher ratio indicates that users are returning frequently and engaging consistently. In Web3, stickiness can also include recurring onchain actions such as staking, swapping, or governance participation. This metric shows how indispensable your product is to users in their daily onchain activity.
8. Why is cohort analysis valuable for Web3 growth teams?
Cohort analysis groups users by shared characteristics—such as wallet creation date, campaign source, or first transaction type—and tracks how their behavior evolves over time. For Web3 projects, this reveals retention patterns, highlights which acquisition channels bring long-term users, and uncovers drop-off points in the funnel. Regular cohort analysis allows teams to refine incentive programs and build sustainable growth strategies.


