

Key Takeaways
Product engagement shows how users interact with your product.
Core metrics include DAU, retention rate, churn rate, and feature adoption.
Tracking engagement improves UX, retention, and reduces churn.
Engagement data powers product-led growth and smarter marketing spend.
Product engagement metrics act as a compass for startups and businesses, guiding them toward better user experiences, stronger growth, and improved product performance. By tracking these metrics, you can uncover valuable insights into user behavior, optimize product features, and make data-driven decisions that fuel long-term success.
In this guide, we’ll cover the 10 most important product engagement metrics, why they matter, and how to measure them. Learn how using a Web3-native analytics platform helps teams track engagement and unlock product-led growth.
Formo helps Web3 teams measure and analyze engagement effortlessly.
What is product engagement?
Product engagement is a critical component of creating a successful startup.
Product engagement metrics measure how actively users interact with your product and how much value they gain from it. Metrics such as time spent in product, retention rate, and feature adoption reflect how engaged your users are. By analyzing product engagement, you can gain valuable insights into what's working with your product and identify areas for improvement.

Product engagement metrics helps data-driven teams build products users want
Measuring product engagement allows product teams to:
Monitor user activity across the product.
Understand how users are spending time within your product
Drive revenue through product-led growth.
Make smarter product decisions with data
User engagement metrics offer insights into user behavior, preferences, and customer satisfaction levels. They help brands understand what features or product offerings build user engagement and what factors causes disengagement.
Why is product engagement important for startups?
For startups, product engagement has a direct impact on growth, retention, and revenue.
High engagement = users find value in your product and keep coming back.
Strong engagement boosts retention, lowers churn, and reduces acquisition costs.
Consistently engaged users are more likely to upgrade, renew, and advocate for your product.
Product engagement reflects how well customers interact with a product, impacting retention and growth. Companies can enhance the product experience and increase product usage by measuring product engagement.
Simply put: better engagement means sustainable growth.
10 Important Product Engagement Metrics
Here are the Web3 product metrics every growth team should track.
1. Daily / Weekly / Monthly Active Users (DAU, WAU, MAU)
Daily Active Users (DAU), Weekly Active Users (WAU), and Monthly Active Users (MAU) are metrics that measure how many unique active users are actively using your product over time.
By tracking these metrics, you can get a clear picture of how popular and relevant your product is, and how engaged your users are. Active user metrics can help you understand trends and make informed decisions about your platform.
Why it matters: active users highlight growth trends and hints at product-market fit.
2. Average Session Duration
This measures how long users spend using your product. The more value they get, the longer they stay.
The average time spent on the product is a key element in determining product engagement scoring. Users who derive value from the product tend to spend more time using it.
Why it matters: Longer sessions typically mean higher engagement and stronger interest in your product.
Tip: Compare individual usage against benchmarks from other datasets to spot power users and disengaged ones.
3. Conversion rate
The conversion rate is the percentage of users who complete a desired action, such as making a purchase or signing a transaction, out of the total number of users.

Calculating the conversion rate
Why it matters: A high conversion rate shows your product experience effectively guides users toward their goals and solves their jobs-to-be-done.
4. Retention rate
Customer retention shows how many users keep coming back over time.
Retained users consistently and actively interact with your product. Focusing on retention can attract new users, reduce acquisition costs, boost ROI, and drive revenue growth.
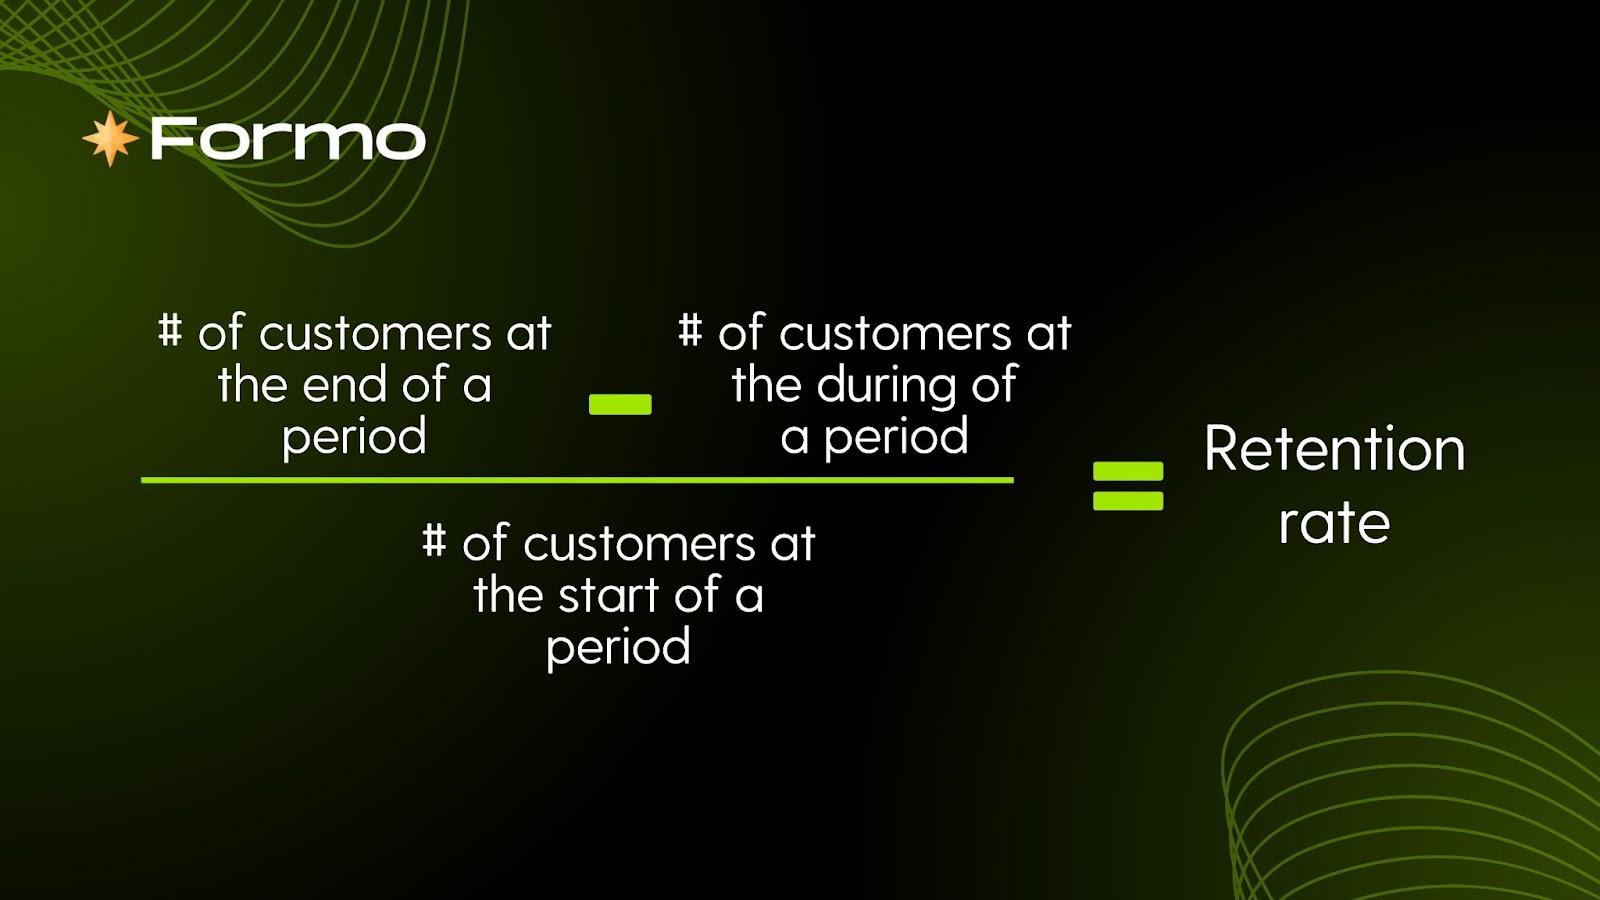
Calculating the Retention Rate
Why it matters: Strong retention reduces churn, improves ROI, and builds customer loyalty.
5. Churn rate
The churn rate is the percentage of users who stop using your product in a given timeframe.
A high churn rate means fewer users are engaged with your product. By identifying the reasons why customers are leaving, product managers can develop strategies to encourage them to return to the product.
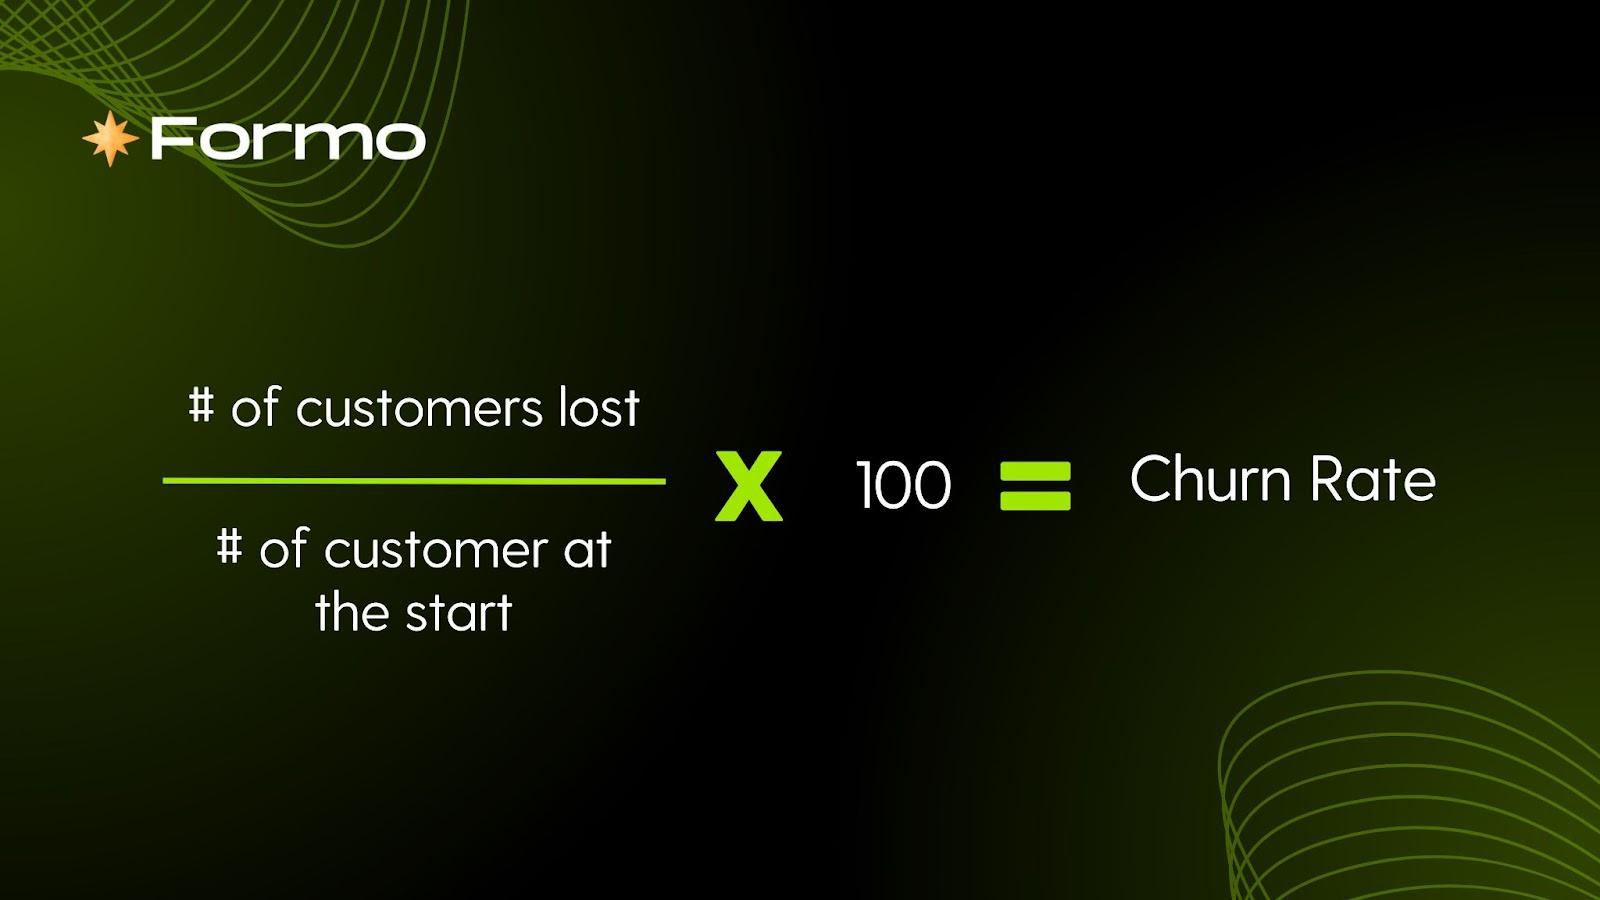
Calculating the Churn Rate
Why it matters: High churn signals poor engagement. Identifying why customers leave helps you fix pain points and win them back.
6. Week 1 engagement
Week 1 engagement measures user interaction with your product within the first week of trial or signup. If adoption is low, they’re likely to churn before activation.
If a user isn’t engaging with your product within the first week, they may churn before reaching full user activation. The reasons for this issue may include challenges with the onboarding process, insufficient customer support, and the absence of key features.
Watch for: Weak onboarding, missing features, or lack of support.
7. Bounce rate
Bounce rate tracks how many users leave after a single page or screen.
The bounce rate helps identify whether users are leaving after completing a specific task or whether potential obstacles are causing frustration. A lower bounce rate means that users find your product engaging enough to explore further within your platform.

Calculating the Bounce Rate
Why it matters: A low bounce rate means users explore deeper into your product instead of dropping off early.
8. Feature adoption rate
Feature adoption = % of users actively using a specific feature.
When customers begin using specific features of a product, it is called feature adoption. A high feature adoption rate means a feature is popular with users.
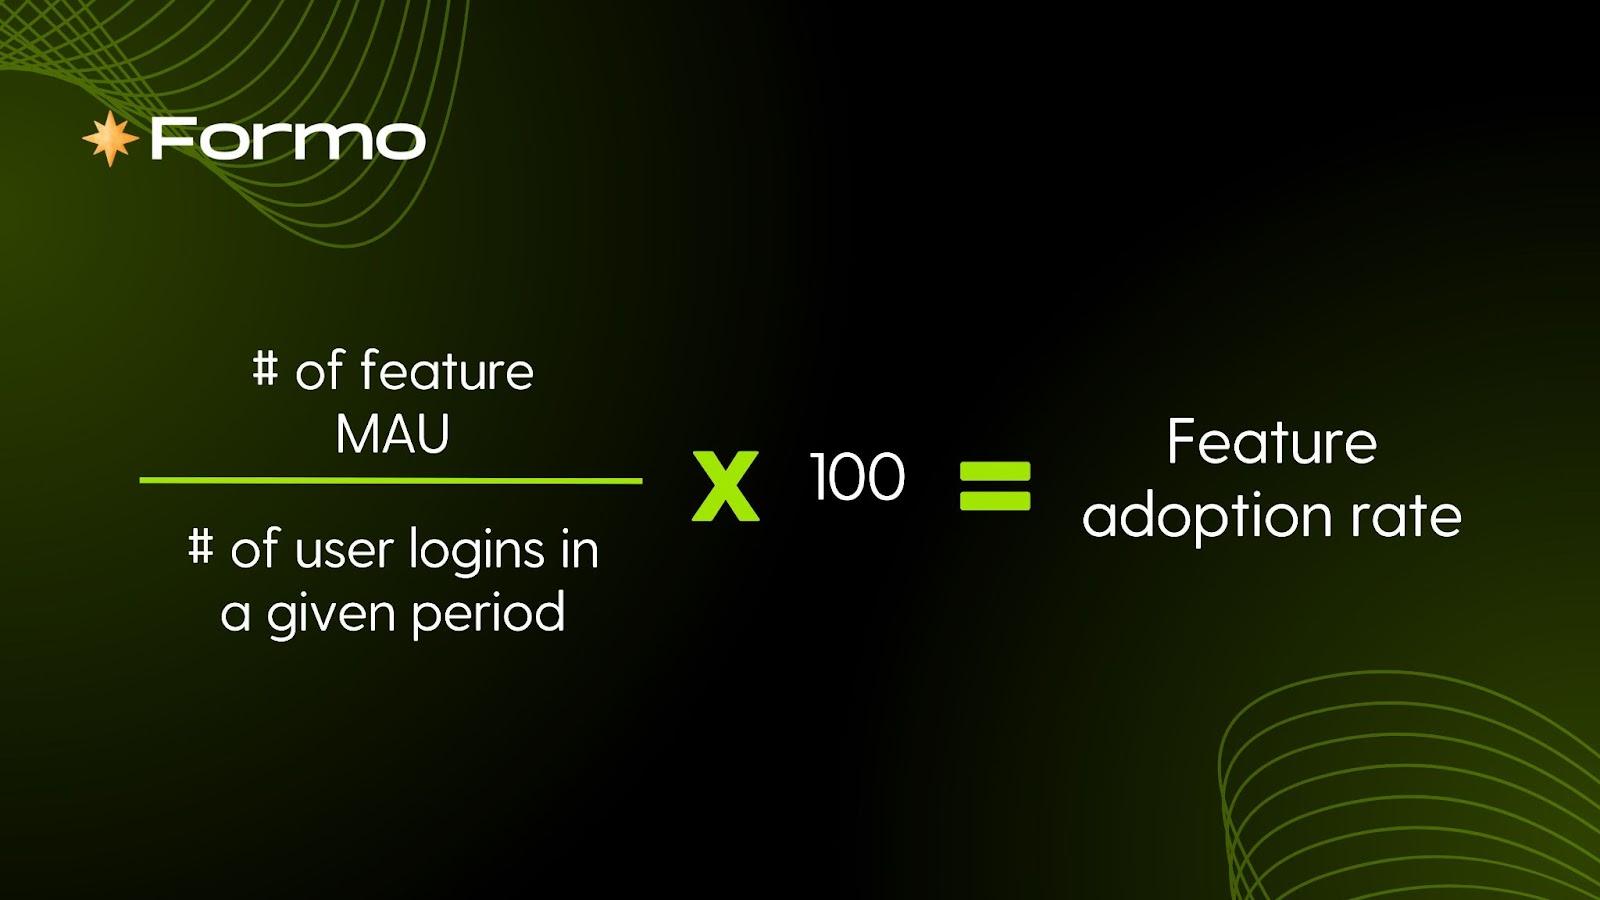
Calculating the Feature Adoption Rate
Understanding why users engage with certain features can provide valuable insights. If a feature has low adoption, it should be monitored closely. The low feature adoption can either be improved or removed entirely.
Why it matters: High adoption signals a valuable feature. Low adoption could mean poor visibility or usability.
9. Net Promoter Score (NPS)
The Net Promoter Score (NPS) measures customer loyalty by asking: “How likely are you to recommend our product?”
A higher NPS means your users are satisfied with your platform and are inclined to advocate it to others, which can help you acquire and retain more users.

Calculating the Net Promoter Score
Why it matters: A high NPS means satisfied customers who will promote your product organically.
The standard method for calculating NPS involves surveying your customers through an online form.
Example Net Promoter Score survey question
10. Referral rate
Referral rate is a key product engagement metric that measures the percentage of users who actively recommend your product to others, often through referral links, codes, or word-of-mouth.
A high referral rate signals strong user satisfaction and trust, since people typically only share products that deliver real value to them. It also reflects deeper engagement because users go beyond simply using the product—they advocate for it.
Monitoring referral rate helps product teams understand how well their offering resonates with customers, identify growth opportunities driven by network effects, and evaluate the effectiveness of referral programs as part of the overall engagement strategy.
How to measure product engagement
To measure engagement effectively:
Define the right KPIs for your product.
Track behavioral data like retention, usage, and feature adoption.
Use product analytics tools to visualize trends and gain insights.
By selecting the appropriate Key Performance Indicators (KPIs) for user engagement, you can identify features and areas for improvement.
For SaaS and Web3 startups, these insights drive product improvements, smarter marketing, and higher ROI.
Brands can utilize tools such as Forms and Product Analytics tools to drive data-driven decisions by leveraging insights from product engagement metrics. Product Analytic tools empower SaaS companies to optimize product development and successfully cater to customers' requirements.
Jumpstart your Product Analytics with Formo
Formo is a Web3-native Product Analytics platform built for startups, creators, and growth teams. With Formo, you can:
Track adoption, retention, and churn.
Understand how users interact with your product.
Make data-driven decisions that fuel product-led growth.
With accurate data, teams can confidently measure and invest in what works.
Measuring product engagement is key to understanding product health and marketing performance. Understanding these 10 important product metrics enables product teams to learn how to build products that connect with your target audience.
Learn more:
8 Web3 Product Analytics Use Cases to Supercharge Your Growth
Web3 Go-to-Market Strategies: New Approaches and Key Metrics
Follow us on LinkedIn and X for more onchain growth insights.
FAQs
1. What is product engagement?
Product engagement measures how actively and frequently users interact with your product. High engagement signals that users are finding real value, leading to stronger retention, customer loyalty, and long-term growth. Low engagement, on the other hand, often indicates poor product–market fit or usability issues.
2. Why are engagement metrics important?
Engagement metrics matter because they:
Reveal how users behave inside your product
Highlight drop-off points where churn occurs
Show which features drive the most value
Guide product design and marketing strategies with data-driven insights
Without tracking engagement, teams are left guessing what works—and what doesn’t.
3. What are the most important product engagement metrics?
While priorities vary by product, the most common engagement KPIs include:
DAU / MAU (Daily & Monthly Active Users): Measures overall product usage and popularity
Retention Rate: Shows how many users keep returning
Churn Rate: Identifies users who stop engaging
Feature Adoption Rate: Tracks which features gain traction
Net Promoter Score (NPS): Measures customer satisfaction and loyalty
Together, these metrics provide a holistic view of user activity, stickiness, and growth potential.
4. How can I measure product engagement effectively?
To measure engagement accurately, teams should:
Define KPIs aligned with product goals
Use product analytics tools to track and visualize user behavior
Segment users (e.g., new vs. loyal customers) for deeper insights
Track trends over time to detect early signals of churn or growth
Tools like Formo make this easier by providing Web3-native analytics tailored for startups and dApps.
5. How does Formo help with product analytics?
Formo is a Web3 product analytics platform built for growth and product teams. It helps you:
Track adoption, retention, and churn in real time
Measure engagement at the wallet level (unique to Web3)
Identify which features, campaigns, or communities drive value
Improve user experiences with data-driven insights
By combining product analytics, onchain data, and marketing attribution, Formo enables teams to reduce churn, boost retention, and accelerate product-led growth.


