

Key Takeaways
Web3 product analytics combines onchain transaction data with offchain behavioral signals to give product teams a unified view of the user journey, something neither a blockchain explorer nor a traditional analytics tool can provide alone.
It helps you track key metrics such as activation, retention, lifetime value (LTV), adoption, and engagement.
Identify friction points and drop-offs to improve activation and drive product-led growth. Wallet connection drop-off is the highest-leverage friction point to diagnose in any dApp: the gap between users who visit and users who connect their wallet often exceeds 80%, and small improvements at this step compound through the entire funnel.
The eight product analytics use cases map to the full lifecycle: acquisition channel analysis, onboarding funnel optimization, feature adoption tracking, cohort retention analysis, churn prediction, LTV modeling, product-market fit measurement, and community engagement monitoring.
Segmenting users by onchain wallet behavior such as transaction frequency, protocol depth, and asset holdings identifies high-LTV users early and enables targeted re-engagement before at-risk wallets churn.
Real-time analytics enable faster product iteration: teams that surface wallet-level behavioral signals the same day they occur can respond to friction or drop-offs within hours rather than after the next weekly data pull.
In the DeFi ecosystem, user behavior is far more complex than in traditional Web2 applications. Users interact across websites, apps, protocols, and social channels — often on multiple wallets and chains. Without analytics, you can’t see which features drive adoption, what campaigns deliver ROI, and why users churn. Unfortunately, most Web3 apps and platforms aren’t used to having in-depth reports. This makes it hard for onchain apps to achieve product-market fit and scale sustainably.
Product analytics helps teams optimize digital products by tracking how users interact with them. Key metrics such as conversion, activation, and churn provide insights that drive better product decisions.
Web3 product analytics consolidates onchain blockchain data with offchain engagement data to give you a complete 360° view of your users. By tracking metrics like activation rate, retention, churn, and lifetime value (LTV), you can make data-driven decisions that directly impact growth, without guesswork.
In this guide, you’ll learn:
What Web3 product analytics is and how it differs from traditional Web2 analytics.
Core metrics that matter for onchain product and marketing teams from acquisition to retention.
How different roles (PMs, marketers, growth managers) use product analytics.
Best practices for implementing product analytics in Web3.
8 real-world use cases.

Web3 product analytics reveals how users interact with a dApp for product and marketing teams
What is Web3 Product Analytics?
Web3 product analytics reveals how users interact with a dApp, providing more valuable onchain insights than traditional analytics tools such as Google Analytics. By tracking user actions (events) within a dApp, Web3 teams can improve retention, identify friction points, and acquire high-value users.
User actions include:
Offchain signals – website visits, marketing campaign clicks, community engagement.
Wallet interactions – wallet connections, message signing, transactions
DeFi activity – DeFi positions, transaction volume, contract interactions
Cross-chain behavior – activity across Ethereum, Polygon, Base, Solana, etc.
Web3 analytics gives you verified, tamper-proof behavioral data from the blockchain, not just inferred activity from internal databases or logs. Analyzing Web3 user behavior helps Web3 teams enhance features, boost engagement, and increase conversion rates — ultimately driving product adoption and meaningful growth.
Key Metrics for Web3 Product Analytics
Understanding key metrics helps onchain product and growth teams understand where they are and where they should go.
Metric | Why It Matters | Example in Web3 |
Activation Rate | Measures how effectively new users complete key onboarding steps. | % of wallets that connect and perform their first transaction. |
Engagement | Tracks how often and how deeply users interact with your dApp. | Average transactions per wallet per week. |
Retention | Reveals how well you keep users over time. | DAU/WAU/MAU wallet activity. |
Customer Lifetime Value (LTV) | Calculates long-term revenue and monetization potential. | Protocol fees, Token holdings, transaction volumes, TVL. |
Adoption Rate | Measures uptake of new features. | % of active wallets using a new feature. |
Churn Rate | Identifies users who stop engaging. | % of wallets inactive for 30+ days. |
How Different Teams Use Web3 Product Analytics
1. Product Managers
Prioritize features based on usage patterns – Identify which features are most frequently used across different wallet segments (e.g., DeFi degens vs. passive holders) to guide roadmap decisions.
Track feature adoption rate and trial-to-paid conversions – See how many wallets interact with a feature after launch, and how that correlates with onchain payments or subscriptions.
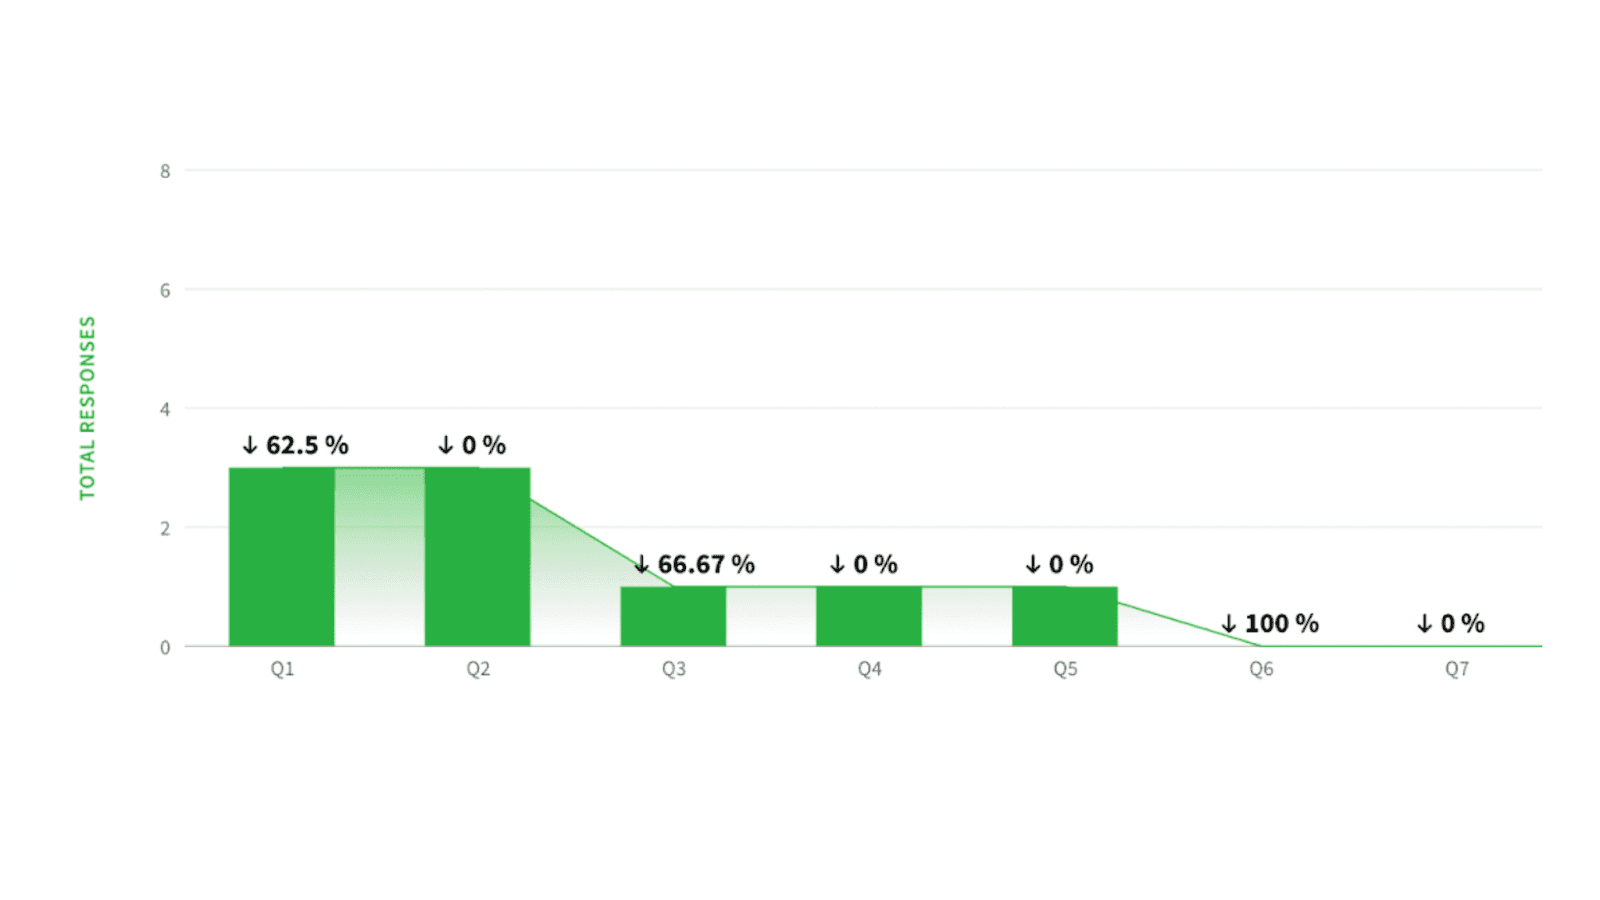
Identify bottlenecks in onboarding – Use funnel analytics to pinpoint drop-offs between key steps (e.g., wallet connection → first transaction → recurring usage).
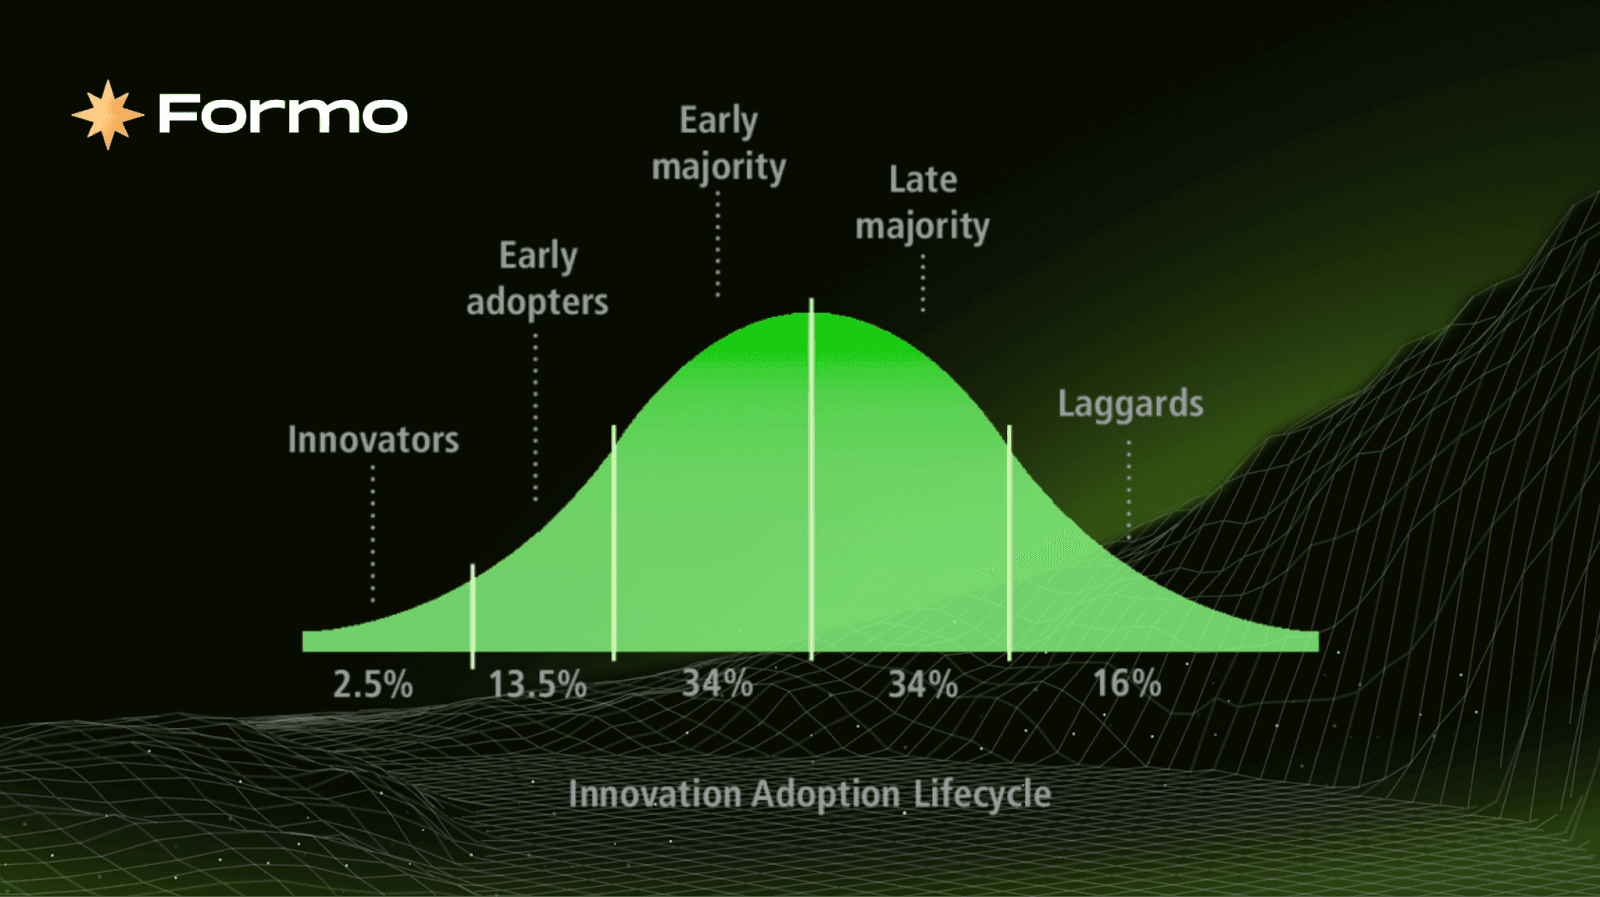
Example of Innovation Adoption Lifecycle
2. Marketers
Measure campaign impact on onchain behavior – Go beyond clicks and impressions; track wallet-level engagement and transactions triggered by specific campaigns.
Use retention rates, active users (DAU/WAU/MAU), and bounce rates to measure the effectiveness of specific marketing tactics on onchain activity.
Track conversion from Twitter ads → wallet connection → transaction – Attribute revenue and sign-ups directly to specific ad creatives or influencers.
Focus on high-LTV user acquisition – Identify acquisition channels that bring in wallets with strong retention and high transaction volumes.
Web3 marketers leverage onchain data from Web3 product analytics to enhance marketing campaigns
3. Developers & Engineers
Monitor key funnel drop-offs for technical bugs – Spot if a sudden drop-off correlates with performance bottlenecks or RPC errors in your happy path.
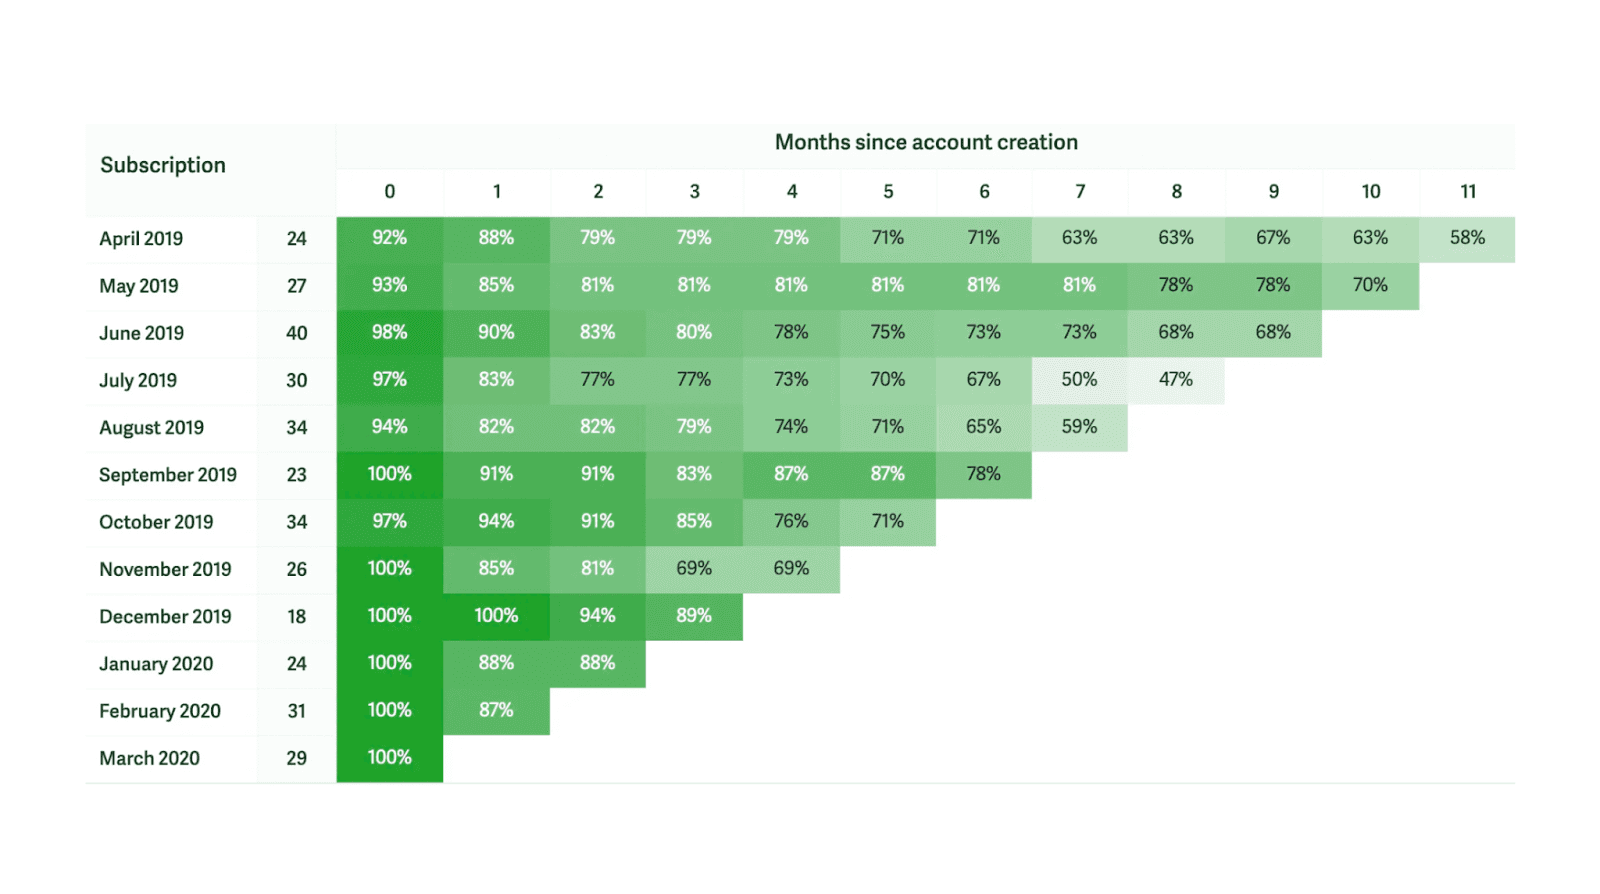
Use cohort analysis to spot regressions after code changes – Compare user engagement before and after a deployment to ensure no unintended impact on critical flows.
Track failed transactions for debugging – are users running out of gas? Segment by network, wallet type, or contract interaction to prioritize fixes.
4. UX Designers
Track metrics such as onboarding completion rate and task success to understand where users are struggling within the app.
Identify where users drop-off – See if users leave during wallet connection, signing prompts, or specific screens.
Optimize onboarding flows and especially wallet connection and transaction signing flows – Use product analytics to compare user activation across wallet connection methods (WalletConnect, MetaMask, Coinbase Wallet) and reduce friction.
Web3 UX designers use analytics to identify drop-offs and determine the reasons behind them. These insights guide design improvements to create a more intuitive and seamless user experience.
5. Business Development
Segment users by wallet profile – Classify wallets as spenders, collectors, whales, or power users to understand product-market fit.
Forecast growth and revenue potential – Use transaction frequency and average transaction value to model future revenue scenarios.
6. Customer Success Teams
Detect churn signals early – Identify wallets that have stopped interacting or whose transaction frequency is declining.
Engage at-risk users before they leave – Trigger reactivation campaigns, rewards, or educational outreach based on inactivity signals.
7. Growth Managers
Track your app’s activation rate and site bounce rate to gauge the effectiveness of user acquisition strategies.
Optimize referral, airdrop, and KOL campaigns – Measure which incentive-driven campaigns generate lasting wallet activity.
Double down on acquisition channels with high conversion – Invest more in influencers, DAOs, or communities that consistently bring in high-value wallets.
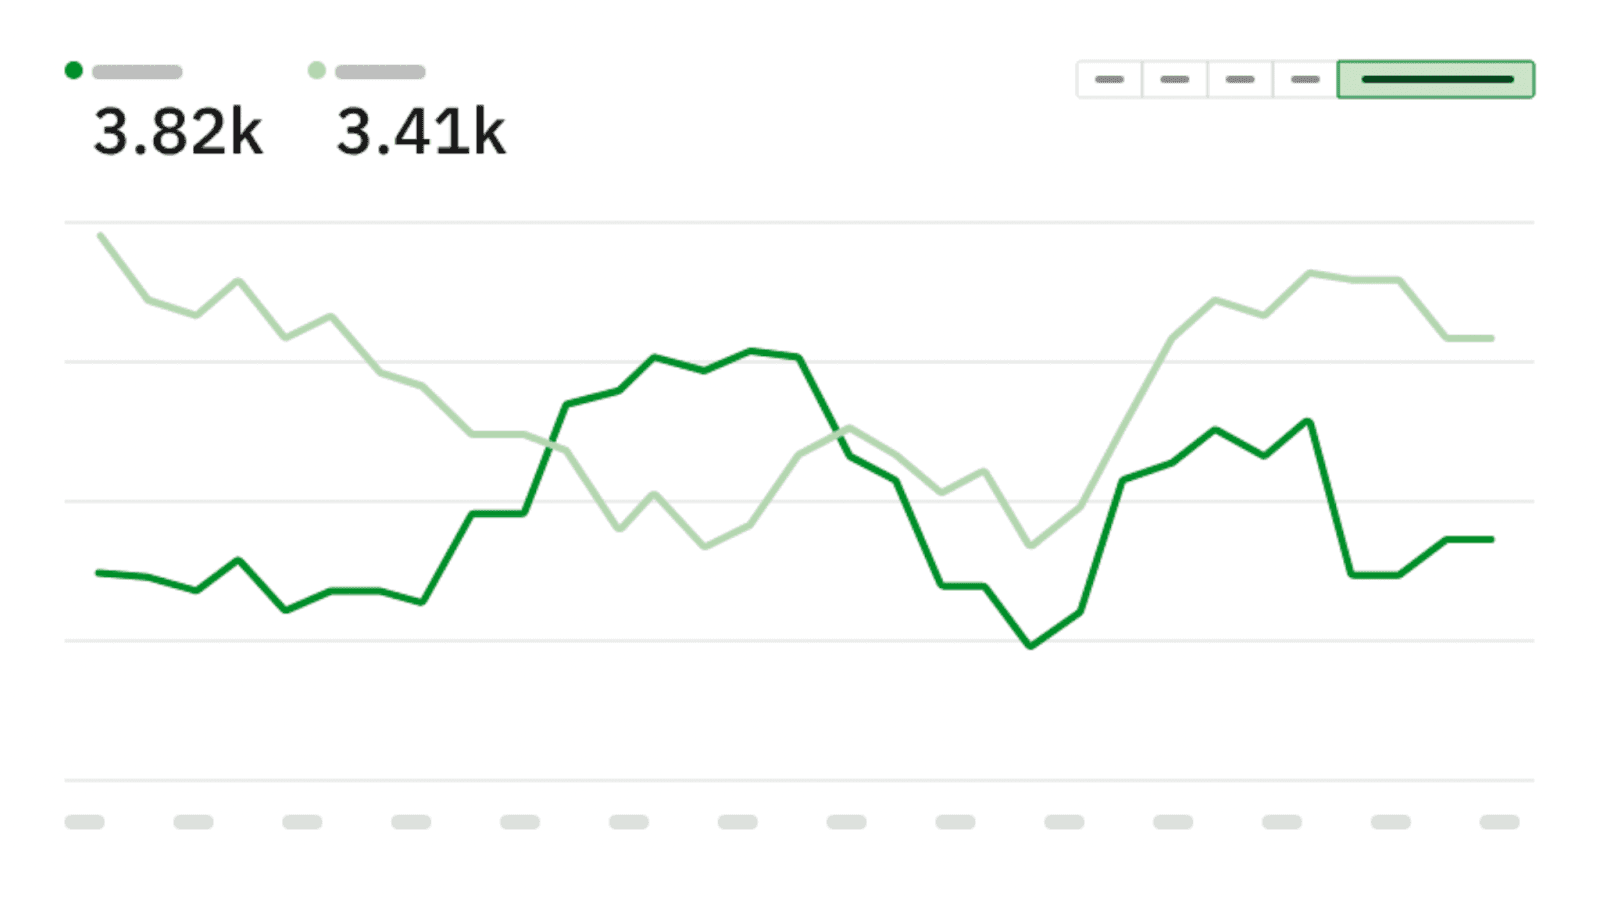
Monitoring key metrics helps data-driven teams surface insights that accelerate growth by reducing friction and improving conversion rates
Best Practices for Product Analytics in Web3
To get started with product analytics for your onchain app, follow these best practices:
1. Choose a Crypto-Native Analytics Tool
Use analytics platforms built specifically for onchain apps such as Formo instead of relying solely on traditional analytics tools like GA or Posthog.
Look for crypto-native features like:
Wallet intelligence: Monitor individual user activity tied to their wallet history, DeFi positions, and token holdings .
Onchain attribution
Smart contract event indexing: Capture and get notified when users stake, mint, swap, or claim rewards.
Multi-chain support: Aggregate activity across Ethereum, Polygon, Base, and other chains without losing attribution accuracy.
Example: Formo can show which of your users used a competitor DeFi protocoland later interacted with your app and smart contract.
2. Align Metrics with Business Goals
Define North Star metrics that directly tie to your product’s growth, such as:
Activation rate – % of connected wallets that complete their first meaningful action.
Retention rate – % of wallets returning after 7/30 days.
Lifetime Value (LTV) – Average value generated per wallet over its lifecycle.
Avoid vanity metrics like total wallet connections or page views without context.
Track these over time to make data-driven decisions on feature prioritization and optimization.
Example: A DeFi platform may focus on volume, fees, or Total Value Locked (TVL) instead of total number of transactions.
3. Set Up Event Tracking
Capture key events in your user funnel.
Standardize how you captureevents to avoid messy, inconsistent data.
Include all key properties for every event (the Formo SDK does this automatically):
Wallet address
Network/chain
Contract address
Transaction hash
Timestamp
For example: for a
Purchase Completedevent, you may want to include the product ids of the purchased products.
When naming events, Formo recommends establishing a consistent naming convention that uses:
Consistent formatting: Event names are case sensitive.
A consistent syntax: Adopt nouns and past tense verbs like
Swap ReviewedandOrder Submitted. A standard of[Noun] + [Past-Tense Verb]ensures all your events are consistent.A consistent actor: Does
Message Sentmean that the user sent a message or that you sent a message to the user? If all your events are named in a way that reflects the user’s perspective, the meaning is clear immediately.
This allows everyone including you 6 months from now to instantly understand the meaning of an event.
4. Integrate Offchain and Onchain Data
Combine blockchain data with offchain sources like:
Website analytics (Google Analytics, PostHog)
Community engagement (Discord, Twitter)
Marketing campaigns (UTM tracking)
This helps you see the full user journey — from Twitter ad click → wallet connect → smart contract interaction → recurring usage.
Example: You might discover that wallets acquired via a specific Twitter ad have 2× higher staking retention than organic users.
5. Review and Iterate Weekly
Avoid waiting until the end of the month to check performance.
Set a weekly review process to:
Spot unusual wallet activity (e.g., sudden churn or spikes in failed transactions)
Validate that new features are performing as expected
Adjust campaigns based on real-time wallet data
Example: If you see a drop in activation after a smart contract update, you can roll back or fix it before losing more users.
8 Real-World Web3 Product Analytics Use Cases
1. Defining Success Beyond the Mint
Challenge: Many NFT projects celebrate a successful mint day but fail to track what happens after.
Web3 projects, such as NFT marketplaces, often emphasize minting events or user acquisition at launch. However, focusing solely on these metrics can overlook long-term engagement and retention. Web3 product analytics enables tracking of wallet interactions, repeat purchases, and activity frequency, ensuring sustainable user growth.
Action items:
Measure % of wallets making secondary market sales within 30, 60, and 90 days.
Track long-term engagement — wallet activity beyond mint day (e.g., voting in governance, participating in community drops).
Impact: Helps shift focus from one-off sales to building a lasting holder base.
2. Optimizing the Launch Experience
Scenario: A DeFi protocol launching new staking/lending features.
For a DeFi protocol, tracking staking, lending, and swapping behaviors is critical. Web3 analytics tools help identify friction points, such as complex wallet connections or failed transactions, enabling teams to optimize the user journey before scaling.
Action items:
Track staking, lending, and swapping behaviors to see which products gain traction fastest.
Identify high transaction failure rates and where they occur (approval, staking contract, swap execution).
Monitor drop-off in onboarding funnel (wallet connection → deposit → first trade).
Impact: Simplifying onboarding and fixing failed transactions boosts activation rates and user confidence before scaling.
3. Powering Product-Led Growth
Scenario: A dApp experiencing low activation rates due to wallet connection failures.
Adopting a product-led growth strategy involves using analytics to detect bottlenecks within decentralized applications (dApps). For instance, if users encounter difficulties with wallet connections or trade execution, real-time data facilitates refining onboarding processes and boosting user engagement.
Action items:
Pinpoint exact steps in the funnel where users drop off (e.g., WalletConnect QR scan, MetaMask approval).
Run A/B tests on onboarding flows (embedded wallet vs. standard wallet connection).
Impact: Fixing onboarding improves activation rate by 20%, unlocking organic word-of-mouth growth.
4. Tracking Early Growth Signals
Scenario: A Web3 marketplace seeking early traction.
A Web3 E-commerce app can utilize analytics to pinpoint popular items and features. Understanding user behavior helps prioritize resources, marketing efforts, and new feature development, accelerating adoption.
Action items:
Identify features driving the highest adoption in the first 30 days (e.g., low-fee listings, bulk listing tools).
Track referral communities sending the most engaged users (e.g., DAO partners, Twitter influencers).
Impact: Doubling down on high-performing features and referral channels accelerates early growth.
5. From Intuition to Data-Driven Decisions
Scenario: A dApp suspects slow growth is due to weak marketing.
Consider a dApp that launched its minimum viable product (MVP). Despite initial growth, the number of new signups is on a downtrend. Web3 product analytics revealed that a signup process was the issue, leading to targeted optimizations and improved conversions.
Action items:
Funnel analysis shows most users never complete signup due to a broken form or wallet approval error.
Fixing signup friction doubles daily active wallets overnight.
Impact: Shows the value of product analytics in diagnosing hidden blockers rather than guessing.
6. Identifying Regional Adoption Trends
Scenario: A blockchain game is noticing organic growth in multiple markets.
A GameFi project tracking user engagement by region may find that Southeast Asian users have higher retention and overall activity. With these insights, the company can tailor marketing efforts to maximize traction in high-performing markets.
Action items:
Compare retention and monetization rates by region (SEA vs. US vs. EU).
Discover SEA users retain 2x longer and spend 30% more.
Adjust marketing budget allocation to favor SEA.
Impact: Boosts DAU by 30% while reducing cost per retained user.
7. Validating Product-Market Fit
Scenario: A quest-based gamified app struggling with retention.
An app that rewards users for onchain activity can analyze onboarding completion rates and usage patterns. If user engagement is low, the team can experiment with alternative gamification and reward mechanisms to boost user adoption.
Action items:
Onboarding analytics show low completion rates.
Add gamified progress bars, badges, and rewards to onboarding.
Retention improves by 25% after implementation.
Impact: Clear signal that gamification resonates with target users, guiding further product roadmap.
8. Refining Marketing ROI
Scenario: A DeFi app targeting multiple user segments.
A DeFi app with an unclear ideal customer profile (ICP) used product analytics to determine that their core users were retail users interested in fixed yield products. By adjusting their product offerings and messaging, they were able to double their activation rate and ROI.
Action items:
Compare conversion rates between user segments such as retail users, institutions, and DeFi degens.
Retail users convert at 2x the rate of DeFi degens and have higher LTV.
Shift ad spend toward retail user communities. Impact: ROI doubles in the next campaign by focusing on high-performing segments
Summary
Web3 Product analytics goes beyond simply tracking data; it helps you acquire a deep understanding of user behavior, including their goals and pain points.
Product analytics is key for sustainable growth. By combining onchain and offchain insights, you can see the full user journey and make data-driven decisions. Start early, focus on meaningful metrics, and let data guide your next growth move.
Data platforms like Formo make analytics accessible for both technical and non-technical teams in web3, allowing real-time tracking and actionable insights without complex data engineering work. Save time and money from having to manage your own data pipelines and infrastructure.
Read more:
Follow us on LinkedIn and X for more onchain growth insights!
FAQs
What’s the biggest difference between Web2 and Web3 product analytics?
The main difference is the scope and type of data tracked.
Web2 analytics focus on offchain data such as pageviews, clicks, and session duration, typically tied to user devices or cookies.
Web3 analytics go deeper by incorporating onchain data such as wallet activity, token transactions, staking, NFT mints, and smart contract interactions. This gives onchain growth and product teams a verifiable and completeview of user behavior alongside traditional engagement metrics.
Web3 product analytics consolidates touchpoints from any source for a complete view of your customer from first engagement offchain to final conversion onchain.
Do I need to be technical to use Web3 analytics tools like Formo?
No. Many modern Web3 analytics platforms, including Formo, are built with no-code dashboards and visual analytics that non-technical teams can use. Get the answers you need without waiting for a data team.
Marketers can analyze campaign impact on wallet activity.
Product managers can track feature adoption and retention.
Growth teams can monitor activation and conversion without writing code.
Bring product and marketing insights together. You and your team can better access your data, analyze and discover unique insights, and use them to make smarter decisions.
Can I use product analytics to track across all of my key touchpoints?
Yes. Map your entire user lifecycle. Pinpoint opportunities to lower CAC by connecting the dots between product usage, channel performance, campaigns, and new power users.
Monitor metrics and performance with customizable dashboards, and follow users across channels with cross-platform tracking.
How can I connect wallet activity to user segments or personas?
By using wallet profiling and onchain behavior analysis, you can group users into meaningful segments:
High-value holders – wallets with large token balances or high transaction volume.
Power users – frequent interactors with your dApp or protocol.
Early adopters – wallets engaging with new features quickly. This segmentation enables personalized outreach, targeted campaigns, and better retention strategies.
How can product analytics help me drive growth?
Tracking clicks is not enough to get a complete picture of your user acquisition. When you run a marketing campaign, measure how those clicks convert to conversions to understand what works.
Measure the true impact of your campaigns. Use onchain attribution, funnel analysis, and event-based session tracking to discover what drives retention and engagement
Avoid wasted resources and missed opportunities. Bad or missing data means wasted marketing—inefficient at best, off-target at worst.
Can product analytics help reduce churn in my Web3 app?
Yes. By tracking critical churn indicators, you can proactively prevent user drop-off:
Drop-off points during onboarding or wallet connection.
Failed transactions or poor user flows are causing frustration.
Decreased engagement, such as fewer transactions or community interactions. With these insights, you can implement personalized re-engagement campaigns, fix UX bottlenecks, and improve retention.
How often should Web3 teams review analytics?
Ideally, weekly — though fast-moving projects may be reviewed daily.
Weekly reviews catch early friction points, validate recent changes, and keep teams aligned.
Monthly deep dives help analyze trends, measure campaign ROI, and refine product strategy. Frequent analytics reviews allow Web3 teams to iterate faster and stay data-driven.
Eliminate blind spots and data silos. Make faster, more impactful decisions on how and where to spend your budget with a complete, real-time view of campaign performance.


