

Key Takeaways
Complete visibility across touchpoints: Track and analyze every interaction to see the full customer experience.
5 core stages to map: Awareness → Consideration → Decision/Purchase → Retention → Advocacy.
Multi-channel + onchain insights: Combine website, email, social, app, and wallet data for a 360° view.
Critical for Web3 growth: In Web3, wallet actions = user behavior, making onchain tracking essential.
Metrics that guide strategy: Focus on CLV, CES, CSAT, session time, bounce rate, and conversion rate.
Data-backed collaboration: Align product, marketing, and CX teams with a shared, analytics-driven journey map.
Customer journey analytics is the process of tracking, connecting, and analyzing customer touchpoints across channels to gain a complete view of the user experience. By revealing how customers progress from initial awareness to loyal advocacy, journey analytics enables you to pinpoint opportunities, eliminate friction, and implement data-driven improvements that enhance satisfaction, retention, and revenue.
In this guide, you’ll learn:
How customer journey analytics works and why it’s essential for growth
The 5 key stages of the journey (Awareness → Advocacy)
The most important metrics to track, from CLV to CSAT
How to connect multi-channel and onchain data for deeper insights
Real-world examples for both traditional and Web3 teams
What is customer journey analytics?
Customer journey analytics involves tracking and analyzing customer interactions across channels to optimize strategies and improve customer satisfaction.
By uncovering patterns in customer behavior, interests, and needs, product and marketing teams can make data-driven decisions to enhance the overall experience. This process captures behavior across multiple channels, such as:
Website and app interactions
Social media engagement
Email responses
In-store visits or customer support calls
Onchain wallet activity (in Web3)
With this approach, teams can:
Understand customer needs and pain points
Identify critical touchpoints
Monitor stage-specific metrics
Incorporate satisfaction and effort scores into strategy
Customer analytics capture data on customer behavior and interactions from multiple channels
Customer Journey Stages
The customer journey map connects the entire lifecycle of a customer’s interaction with a product or service — from initial awareness to becoming a loyal advocate.
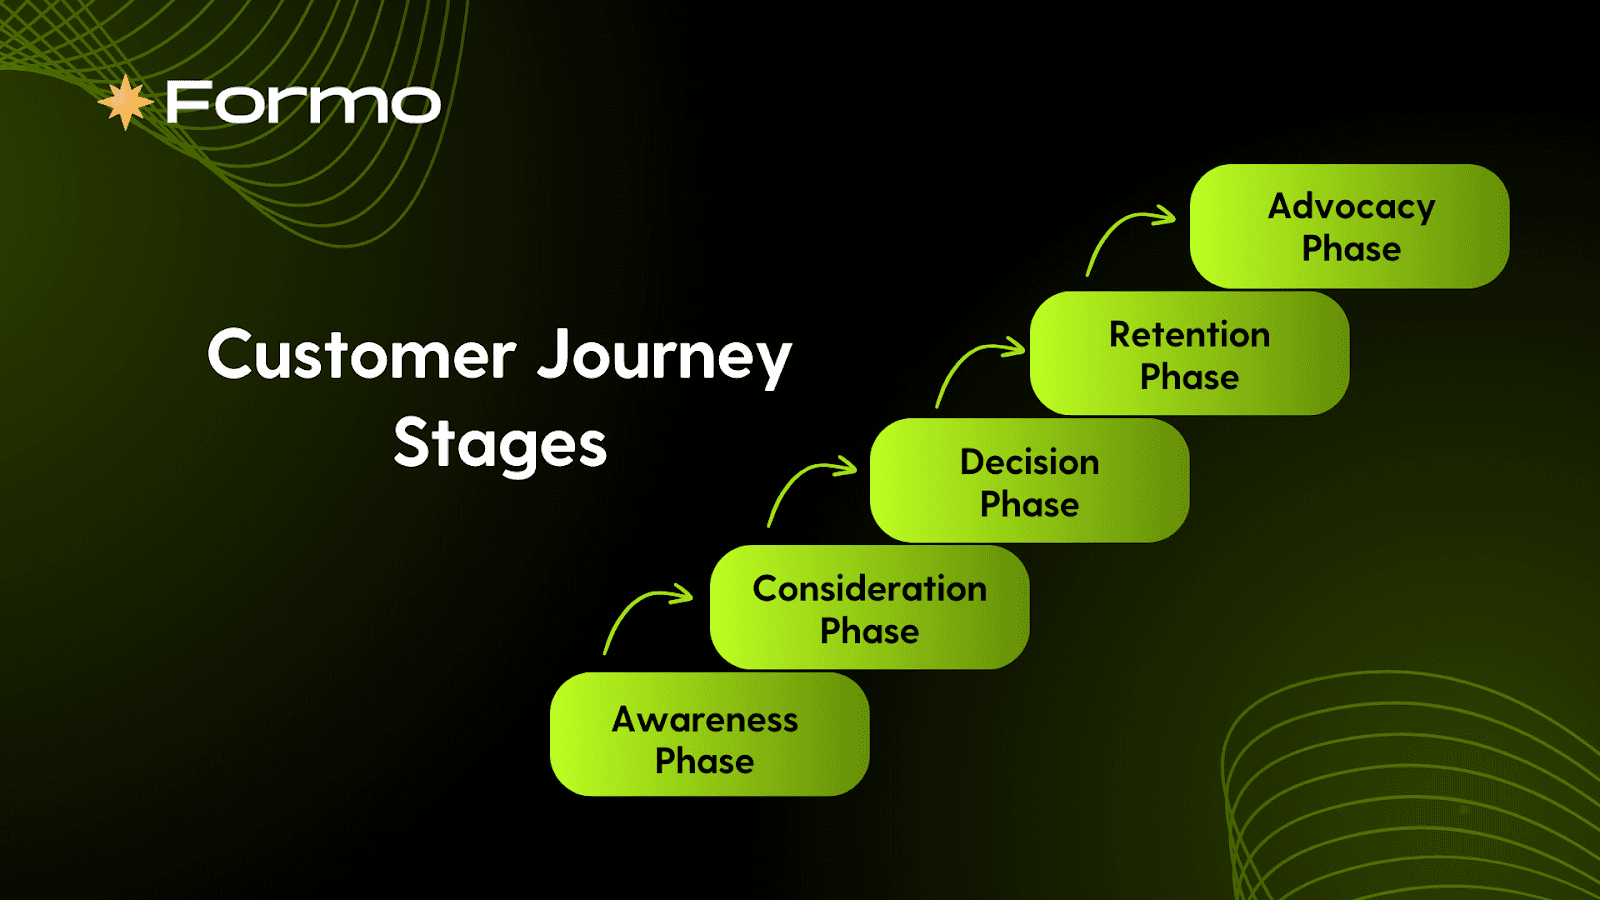
Create a customer journey map to show the stages customers go through when engaging with a brand
1. Awareness
Customers recognize a need or problem and begin searching for solutions. Educational content (e.g., blog posts, white papers, eBooks) resonates more than direct sales messaging.
2. Consideration
Customers compare options, read case studies, and attend webinars. The tone should shift from educational to solution-oriented.
3. Decision / Purchase
Customers are ready to buy, often engaging with sales or support teams. Case studies and testimonials can give your brand an edge.
4. Retention
Post-purchase engagement builds long-term relationships. Use loyalty programs, regular updates, and personalized communication to keep customers engaged.
5. Advocacy
Delighted customers become brand promoters. Encourage referrals with bonuses, loyalty perks, and public recognition.
Effectively guiding customers through each stage can significantly increase satisfaction, loyalty, and advocacy.
The benefits of customer journey analytics

Top 10 benefits of customer journey analytics for product and marketing teams
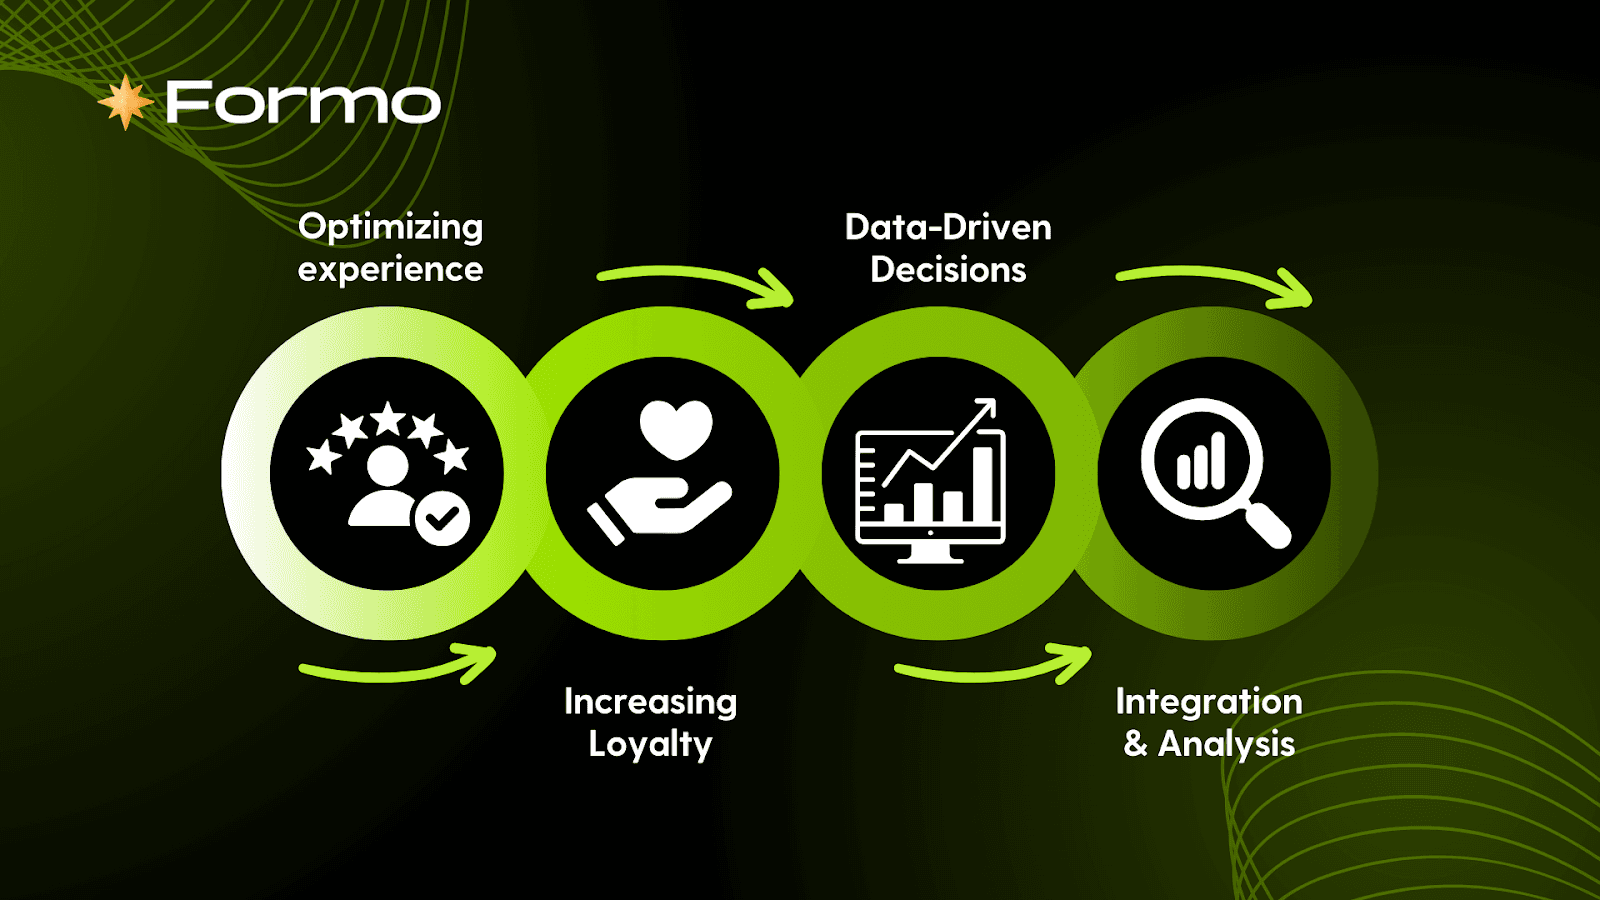
Customer journey analytics provides several key benefits that enhance a customer experience (CX) strategy:
Insight into customer behavior and experience
Customer journey analytics enables product teams to collect and analyze data across all customer touchpoints, providing deep insight into customer behavior. This analysis can help identify successful aspects of the customer journey and areas where customers struggle.
Improve operational efficiency
Customer analytics improve operational efficiency. For example, it can show which issues can be resolved through self-service channels and which require human intervention. This allows customer service agents to focus on more complex problems, resulting in better resource allocation and cost efficiency.
Measure the ROI of CX initiatives
Customer journey analytics enables brands to understand how customer interactions with products or services impact business outcomes, such as revenue generation. It allows for the comparison of different user journeys to determine the most effective ones.
Improve customer retention and reduce churn
User analytics predicts customer behavior and identifies at-risk users, enabling proactive retention strategies through personalized interactions, ultimately reducing churn.
Revenue optimization
By pinpointing and optimizing customer journeys that lead to successful conversions onchain, customer journey analytics helps onchain apps identify the best-performing channels to focus on and maximize revenue.
Behavioral segmentation
Customer analytics helps behavioral segmentation, enabling targeted marketing campaigns that align with customer experience goals and key business outcomes such as revenue, cost, and retention.
Advanced data analysis capabilities
Sophisticated user analytics tools can reduce the time required to prepare and analyze data, empowering businesses to answer more questions on their own and freeing analysts to focus on more complex insights. This democratization of data leads to better decision-making across the organization.
Streamline onboarding
Customer analytics helps eliminate unnecessary touchpoints in the customer journey, reducing friction and improving the overall onboarding experience. It identifies specific points where users experience the most difficulty, allowing your product to prioritize these areas for improvement.
Identify and resolve CX issues
Advanced customer journey analytics tools can pinpoint the root causes of customer experience issues. This allows teams to fix immediate issues, prevent future problems, and improve customer satisfaction.
Enhance customer support
Customer journey analytics is important for understanding customer goals and the effectiveness of digital channels. It enables the implementation of targeted strategies to enhance digital offerings and streamline complete customer experiences, ensuring a harmonious blend of customer contentment and operational cost-effectiveness.
How Customer Journey Analytics Enhances Journey Mapping
When integrated into journey mapping, analytics highlights critical areas to prioritize and fosters collaboration across teams. This unified approach breaks down silos and ensures that hard data backs product improvements.
How to Analyze Customer Journeys (Step-by-Step)
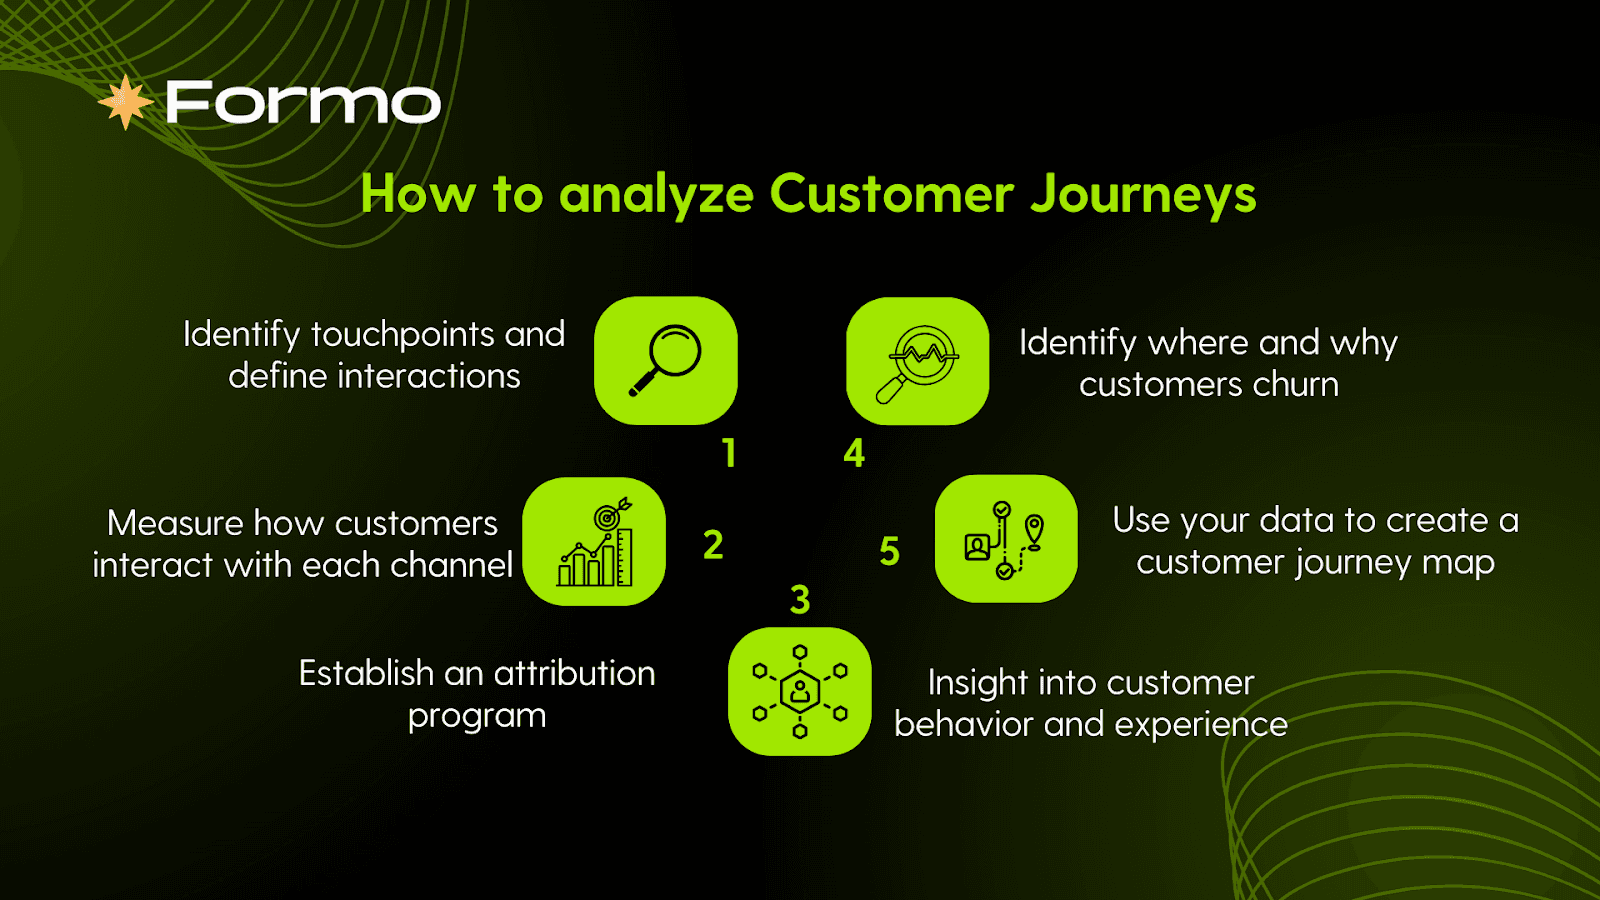
5 Steps to analyze your customer journey
1. Capture key touchpoints
First, organize customer touchpoints by journey stages. For example:
Awareness → Click from another website
Consideration → Watch a demo video
Conversion → Create an account
Service → Contact support
Advocacy → Share referral code
2. Measure engagement across channels: Connect analytics from web, email, app, and social channels to compare interaction rates against KPIs or industry benchmarks.
3. Set up attribution: Understand which touchpoints and channels drive conversions. Clicks are not enough, measure onchain conversions and real revenue.
4. Identify where and why customers churn
: Use surveys, product analytics, and support data to identify where customers drop off.
5. Use your data to create a customer journey funnel : Map customer needs, actions, and emotions at each stage into a series of steps in a funnel. Funnels can span the entire experience or focus on specific user flows, such as onboarding.
7 metrics to analyze the customer journey
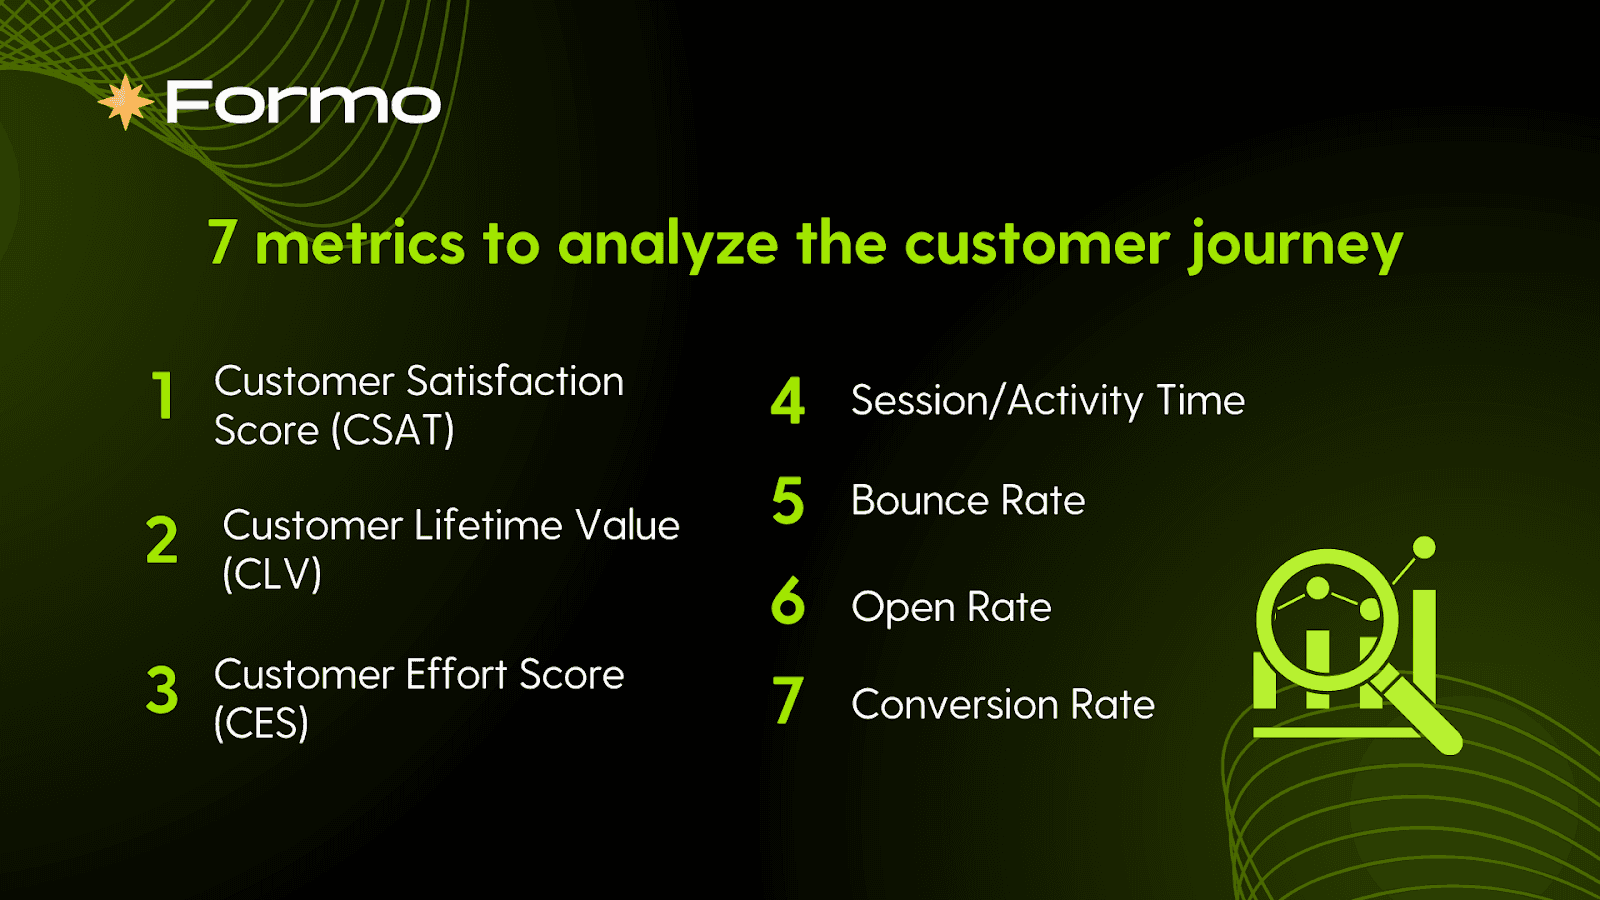
7 Key metrics to analyze the customer journey
In customer journey analytics, the most important metrics to monitor include:
Customer Satisfaction Score (CSAT)
A Customer Satisfaction Score (CSAT) measures user satisfaction with your product or service, typically on a scale of 1 to 10.
How to Calculate Average CSAT = Sum of Satisfaction Scores ÷ Total Number of Responses
Customer Lifetime Value (CLV)
CLV reflects the total revenue you expect to earn from a customer throughout their relationship with your company.
How to Calculate CLV: = (annual revenue per customer x customer lifetime in years) - customer acquisition cost
Customer Effort Score (CES)
CES measures how easy or difficult it is to do business with you through surveys in which customers rate the ease of use on a numerical scale.
Calculation: CES = Sum of Effort Scores ÷ Total # of Responses
Session Duration
Tracking average session time helps you identify trends or outliers in app usage (e.g., drastic drops may indicate bugs or outages, while a steady decline may signal declining engagement).
Calculation:
Session duration = time the user leaves the app - time the user enters the app
Average session time = total session time ÷ number of sessions
Bounce Rate
The bounce rate is the percentage of single-page sessions, where a visitor leaves your site after viewing only one page, out of the total number of sessions.
Calculation: bounce rate = (single page sessions ÷ all sessions) x 100
Open Rate
The open rate measures the percentage of emails that were opened out of all emails sent in a campaign.
Calculation: open rate = (number of emails opened ÷ number of emails sent) x 100
Conversion Rate
Conversion measures the percentage of people who take the action you’ve asked them to take. If 100 people see your CTA to download an ebook and half of them do so, you have a 50% conversion rate.
Calculation: Conversion rate = (# of users who took a specific action ÷ # of total users) x 100.
6 Web3 customer journey analytics examples
Understanding how wallets interact across your dApp is key to growth in Web3. Here are powerful user journey analytics examples tailored to Web3 teams:
1. Onboarding Funnel Analysis
Track how wallets go from first visit to onchain transaction. Useful for: DeFi apps, marketplaces, and consumer apps.
Example steps:
User connects their wallet to an onchain app
User signs a message
User completes their first transaction (deposit/swap/stake)
Metrics to analyze:
Conversion Rate: % of wallets that complete onboarding and activation
Customer Effort Score (CES): How easy users rate the onboarding process
Session Duration: How long does it take from wallet connect to the first transaction
Bounce Rate: % of wallets that connect but drop off before taking action
2. Campaign Attribution
See how wallets discover you and what makes them convert. Useful for: Growth teams running ads, referral links, or Farcaster frames seeking to measure their true ROI.
Example steps:
Clicks a UTM-tagged link
Visits a landing page or Web3 form
Takes an onchain action (mint, stake)
Metrics to analyze:
Open Rate: % of campaign messages or emails opened
Conversion Rate: % of wallets that move from click to onchain action
Customer Lifetime Value (CLV): Value of wallets acquired from each source
CSAT: How users rate the signup or campaign experience
3. Product Usage Journey
Uncover what top wallets are doing inside your app. Useful for: dApp teams looking to improve UX or drive retention.
Example steps:
Signs up or signs in
Performs primary actions such as deposit, stake, borrow, trade, or play
Refers other users through referral programs or affiliate links
Returns and reuses key features, showing ongoing engagement and retention
Metrics to analyze:
Session Duration: Average duration of wallet engagement
CLV: Long-term value generated per active wallet
CSAT: Satisfaction with core product features
Feature Conversion Rate: % of wallets using a key feature who take further action
4. Cross-Chain User Journey
Follow your users as they move across chains and protocols. Useful for: Cross-chain platforms, rollups, bridge products.
Example steps:
Initial transaction on Ethereum
Bridge to Base
Uses a protocol on Arbitrum
Returns to Ethereum
Metrics to analyze:
Conversion Rate: % of wallets that activate on the destination chain
CES: How easy did users find the bridging experience
Bounce Rate: % of wallets that initiate a bridge but never use the app post-bridge
Session Time: How long do cross-chain journeys take end-to-end
5. Community-to-Onchain Journey
Turn engaged followers into onchain power users. Useful for: DAO tooling, community growth teams.
Example steps:
Engages on Farcaster or Telegram
Fills a Web3 form
Mints a badge or votes in governance
Becomes an active contributor
Metrics to analyze:
Conversion Rate: % of community members taking onchain action
Open Rate: % who interact with newsletter or community announcements
CLV: Value generated by wallets from community channels
CSAT: Feedback after community onboarding or governance interactions
6. Grant / Incentive Campaign Funnel
Analyze how wallets interact before, during, and after a drop. Useful for: Protocols running incentive programs or retroactive rewards.
Example steps:
Sees a campaign on X or a newsletter
Completes eligibility
Claims a token or a grant
Starts using the platform
Metrics to analyze:
Open Rate: % of wallets that open eligibility or claim emails
Claim-to-Conversion Rate: % of wallets that claim and use the platform
Retention via Session Time: Do they return post-claim? How long do they stay active?
CSAT: Sent after claim or initial usage to evaluate satisfaction
CLV: Compare airdropped wallets vs. organic wallets over time
Build products people want with Formo
Formo is a Web3-native data platform product analytics tool for onchain teams. It empowers product and marketing teams to:
Track ROI of growth campaigns
Understand your funnel
Identify drop-off and activation points
Formo makes analytics easy. Get the best of web, product, and onchain analytics on one versatile platform. Accelerate your growth loop with unified analytics and attribution.
Learn more:
Follow us on LinkedIn and X for more onchain growth insights!
FAQs
1. How is customer journey analytics different from traditional web analytics?
Traditional web analytics measures basic metrics like page views, bounce rate, and session time, focusing mainly on activity within a single channel (e.g., your website). Customer journey analytics, on the other hand, connects interactions across multiple channels and touchpoints — such as websites, apps, email, social media, and, in Web3, onchain wallet activity. This multi-channel approach reveals the entire customer experience, from first touch to loyalty or churn, enabling more targeted improvements.
2. What tools are commonly used for customer journey analytics?
Popular tools include Mixpanel, Adobe Analytics, Google Analytics 4 (GA4), and FullStory for traditional web and app analytics. For Web3 teams, platforms like Formo offer specialized capabilities such as wallet tracking, onchain event analysis, and integration with Web3 forms. The best tool for you depends on your industry, data sources, and whether you need both offchain and onchain tracking.
3. Can customer journey analytics be used for B2B companies?
Absolutely. B2B businesses often have longer, more complex sales cycles, making customer journey analytics even more valuable. It helps map account-level journeys, identify high-impact touchpoints, and track decision-maker engagement across multiple stakeholders. For example, in a SaaS business, you can follow the journey from a demo request to product adoption, renewals, and upsells.
4. What’s the biggest challenge in implementing customer journey analytics?
The main challenge is unifying fragmented data from multiple systems — CRM, analytics tools, marketing automation, customer support, and (in Web3) blockchain data. Without a unified view, it’s difficult to connect the dots between interactions. Overcoming this requires careful data integration, consistent tracking methods, and possibly a customer data platform (CDP) that merges offchain and onchain activity.
5. How often should I update my customer journey map?
At a minimum, review and update your customer journey map quarterly. You should also refresh it whenever you launch a major feature, campaign, or product update that could change user behavior. In fast-moving industries like Web3, monthly reviews can be beneficial, as wallet behavior and onchain interactions can shift quickly based on market trends, new protocols, or incentive programs.


