

Key Takeaways
Crypto BI dashboards follow a four-stage data pipeline: collection from exchange APIs and blockchain sources, transformation to clean raw onchain data into usable formats, indexing for queryability, then visualization into actionable charts and metrics.
Five design principles determine dashboard effectiveness: match chart type to the message, place critical information top-left, use color sparingly to signal meaning rather than decorate, minimize visual clutter, and prioritize immediate scannability over comprehensiveness.
Fragmented wallet identity is the core crypto-specific pitfall: users with multiple wallets across chains create attribution errors that do not exist in Web2 dashboards, requiring deduplication logic before any user-level analysis is reliable.
Business intelligence dashboards are essential tools for DeFi teams, enabling real-time data visualization and informed decision-making. By integrating onchain and offchain data, these dashboards enhance user engagement and strategic planning. Key features include real-time updates, customization, and portfolio tracking. Best practices involve understanding user needs and minimizing data clutter. As the market evolves, advanced analytics will play a crucial role in optimizing strategies and improving operational efficiency.
Navigating the complexities of crypto analytics can be overwhelming, especially when trying to make sense of disparate data sources. This guide will detail how to effectively implement business intelligence dashboards tailored for crypto, empowering teams to transform raw data into actionable insights. Research shows that companies leveraging advanced analytics can improve decision-making speed by up to 5 times, making it crucial for crypto teams to adopt these tools for sustained growth.
Introduction to Business Intelligence Dashboards for Crypto
Business Intelligence (BI) dashboards have become essential for navigating the complexities of the cryptocurrency market. These tools offer a visual representation of data, allowing crypto teams to track performance metrics, user behavior, and market trends in real-time. As the demand for effective analytics grows, particularly in cryptocurrency investing, leveraging these dashboards can lead to more informed decision-making and enhanced strategic planning.
In today's data-driven world, blockchain data analytics is becoming the backbone of intelligent Web3 decision-making. As decentralised ecosystems explode in complexity and volume, extracting meaningful insights from blockchain data is no longer optional — it's essential.
By integrating data from various sources, BI dashboards empower teams to identify patterns, forecast trends, and optimize their operations. This capability is vital in a rapidly evolving environment where timely insights can significantly impact investment outcomes. As the crypto landscape continues to mature, the role of BI dashboards in facilitating effective analysis and strategy formulation will only increase in importance.
Understanding Business Intelligence Dashboards
Business Intelligence dashboards play a crucial role in the cryptocurrency sector by providing teams with the tools to visualize and analyze data effectively. These dashboards aggregate real-time data, enabling live tracking of key performance indicators that are essential for informed decision-making. As the cryptocurrency market evolves, the ability to interpret data quickly and accurately has become increasingly important.
The use of visual analytics allows businesses to make data-driven decisions, enhancing their strategic planning processes. Performance benchmarking becomes feasible as current metrics can be compared to historical data, helping teams identify growth patterns. Furthermore, improved accuracy is achieved through structured data input, which minimizes errors in calculations.
Additionally, enhanced visualization through interactive charts and tables simplifies complex data, making it accessible for users at all levels. As organizations strive to stay competitive in a rapidly changing landscape, these dashboards serve as indispensable tools for navigating the intricacies of the DeFi ecosystem.
What is a Business Intelligence Dashboard for Crypto Protocols?
Business Intelligence dashboards for crypto protocols enable teams to visualize onchain data effectively, enhancing decision-making. By integrating real-time analytics, these dashboards allow users to monitor transaction volumes, user interactions, and market trends. This visibility supports proactive adjustments to strategies and optimizes user engagement.
How Business Intelligence Dashboards Work in Crypto
Business Intelligence dashboards in the cryptocurrency sector primarily operate through a structured process involving several key stages.
Data Collection: Data is gathered from various sources, such as cryptocurrency exchange APIs like CoinGecko and CoinMarketCap, or public datasets.
Data Transformation: Raw blockchain data is often complex, requiring cleaning and organization into usable formats.
Indexing and Querying: The organized data is indexed for accessibility, typically through APIs using GraphQL.
Visualization: Finally, the processed data is visualized into dashboards and charts, providing insights into market performance, trends, and user behavior.
This structured approach enables crypto teams to make informed, data-driven decisions.
Key Features of Crypto Business Intelligence Dashboards
Business Intelligence dashboards for crypto offer several key features that enhance data analysis and decision-making. These include:
Real-Time Data: Provides up-to-the-minute information on prices, market trends, and portfolio performance.
Customization: Allows users to tailor the layout and select specific metrics, charts, and widgets to display.
Portfolio Tracking: Offers comprehensive capabilities to monitor investments across multiple exchanges and wallets in one place.
Security: Implements robust measures like two-factor authentication and encryption to protect sensitive information.
Integration with Exchanges: Seamlessly syncs portfolio data and trading activities by connecting with the cryptocurrency exchanges you use.
These features collectively create a powerful tool for navigating the complexities of the cryptocurrency market.
Best Practices for Implementing Dashboards in Crypto
Understanding your audience is crucial before building any dashboards; conducting user research helps identify the most relevant information for key stakeholders.
Choosing the right charts enhances data interpretation. For example, bar charts are ideal for comparisons, line charts effectively show trends, and pie charts represent proportions clearly. Additionally, arranging elements meaningfully is essential. Placing critical information in the top-left corner aligns with users' natural reading patterns, which typically flow from top to bottom and left to right.
Utilizing color effectively can also improve dashboard usability. Using color to convey meaning should be done sparingly and consistently to highlight important data points rather than for aesthetic purposes. Lastly, it is essential to minimize noise by avoiding clutter. Excessive visual elements or textures can distract or confuse users, undermining the dashboard's effectiveness.
A user should be able to glance at your dashboard and instantly get the gist. This is why many great dashboard designs aren't fancy. They're clean, easy to read, and straight to the point.
By adhering to these best practices, teams can create dashboards that facilitate informed decision-making and enhance user engagement.
Common Mistakes to Avoid with Crypto Dashboards
Common mistakes can hinder the effectiveness of crypto dashboards, leading to misinformed decisions. These include:
Overwhelming Data Volume: The sheer amount of on-chain data can be daunting to analyze effectively.
Data Interpretation: Raw blockchain data can be difficult to interpret or correlate without specialized skills and tools.
Market Volatility Distortion: High market volatility can distort the meaning of metrics if not considered in the proper context.
Fragmented Identity: Users may have multiple wallets, making user-level attribution and segmentation difficult compared to Web2.
Relying Solely on On-Chain Data: On-chain analytics doesn't provide the full picture or context behind market sentiment, potentially causing analysts to miss the broader strategic narrative.
Addressing these pitfalls can enhance the utility of crypto dashboards and improve decision-making processes in the rapidly evolving landscape of cryptocurrency.
How Formo Enhances Crypto Business Intelligence
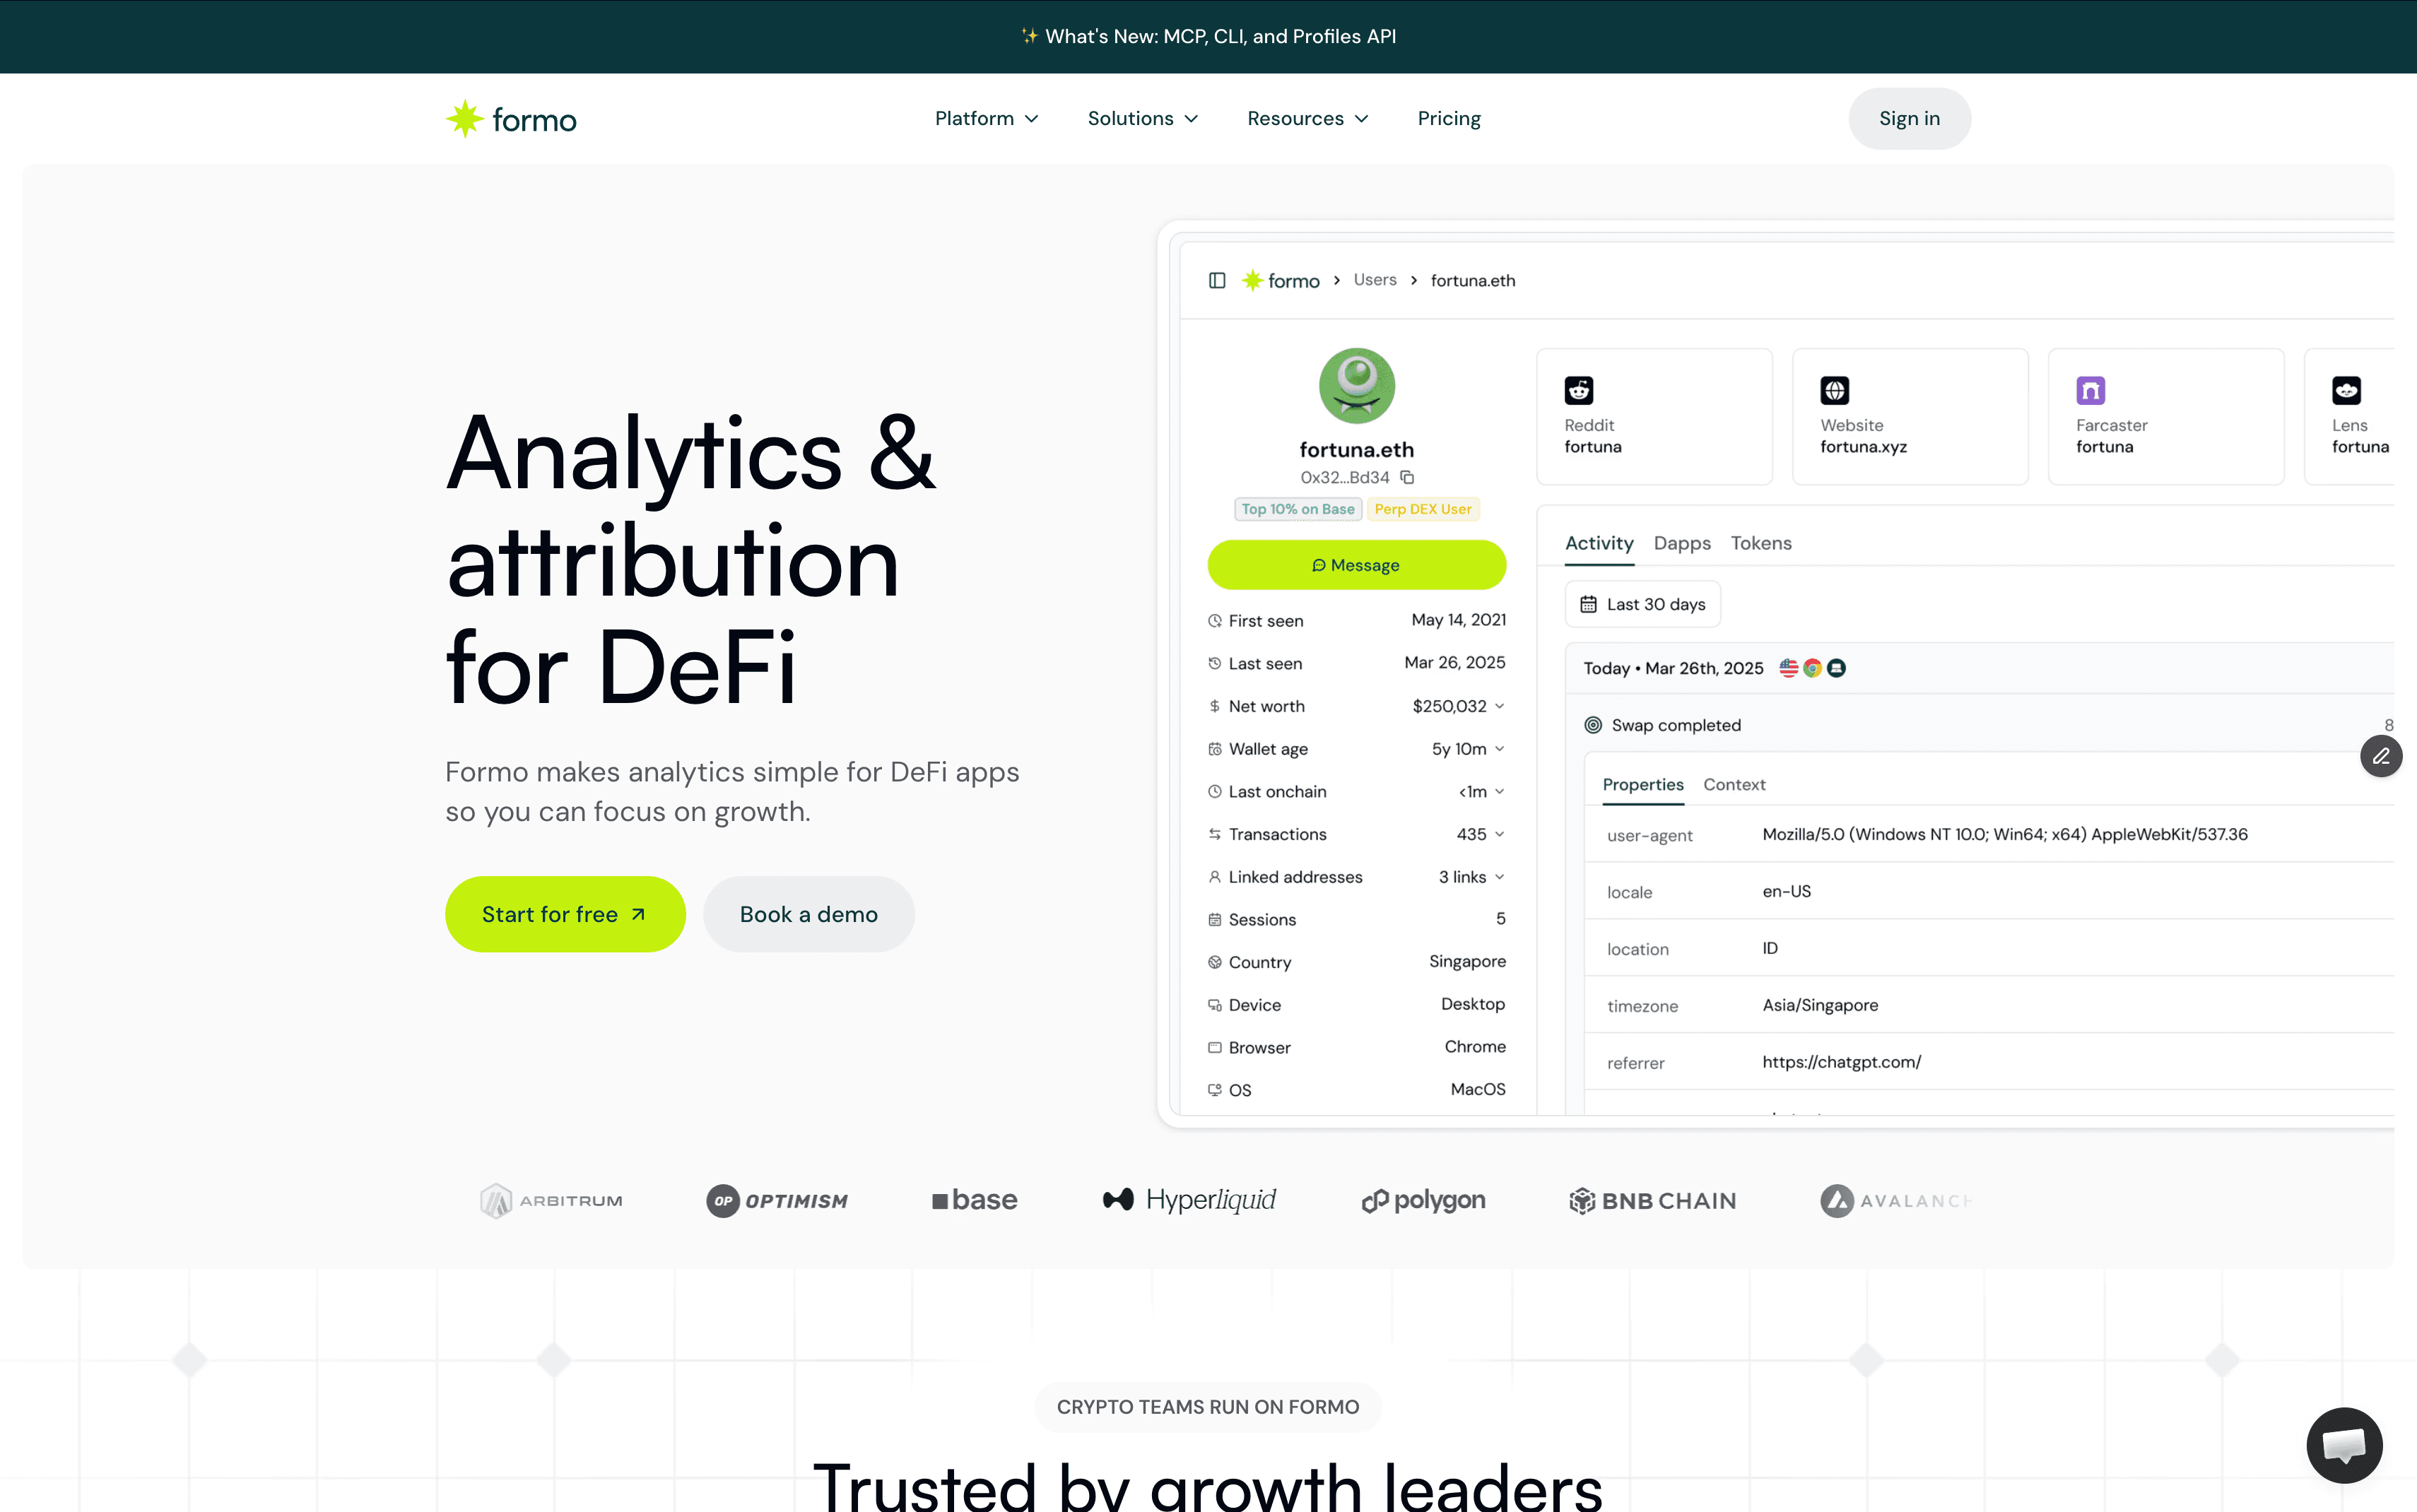
Formo enhances crypto business intelligence by integrating crucial analytics for informed decision-making. This platform unifies on-chain and off-chain data to provide a complete view of user behavior, enabling teams to gain insights that were previously fragmented. By focusing on wallet-level analytics, Formo allows businesses to understand users without relying on personal identifiers, which is vital in maintaining privacy and compliance.
Furthermore, the platform helps teams analyze user segments and growth channels across both data sources, facilitating a more comprehensive understanding of user interactions and preferences. This capability is essential as companies strive to tailor their strategies to meet the evolving demands of the market.
Another significant advantage is Formo's aim to solve data fragmentation and the lack of unified identity. By addressing these challenges, the platform enhances attribution and segmentation, which are critical for effective marketing and product development strategies.
Overall, the integration of these features positions Formo as a valuable tool for crypto businesses seeking to leverage data for strategic advantage. The growing emphasis on analytics in cryptocurrency reflects the market's evolution and the increasing need for robust intelligence frameworks.
The global market for financial analytics, which includes BI dashboards, was valued at $7.99 billion in 2022 and is projected to exceed $18 billion by 2030. This growth is largely driven by the increasing need for analytics in cryptocurrency investment strategies. (Source)
Conclusion: The Future of Business Intelligence in Crypto
The future of business intelligence in the cryptocurrency sector is poised for significant transformation. As the cryptocurrency market matures, the role of data analytics is set to become even more critical. Emerging technologies such as Artificial Intelligence (AI) and Machine Learning (ML) are on the cusp of transforming cryptocurrency analytics, offering even more sophisticated tools for market prediction and analysis.
Key use cases for advanced business intelligence dashboards include:
Detecting suspicious wallet behaviors and flagging anomalies for regulatory audits.
Predicting market trends, such as gas price spikes or NFT popularity.
Optimizing smart contract execution for better performance.
Powering autonomous agents that can act as traders or service providers based on data insights.
The increasing volume of data, especially from faster chains such as Base, Optimism, and Solana underscores the need for advanced analytics tools to extract actionable insights (SubQuery Network). As organizations harness these insights, they will be better equipped to make informed decisions, adapt strategies, and enhance operational efficiency in a rapidly evolving market landscape. The integration of AI and ML into business intelligence will further empower teams to navigate complexities and seize opportunities within the crypto ecosystem.
FAQs
What types of data can be integrated into crypto business intelligence dashboards?
Crypto business intelligence dashboards can integrate various data types, including onchain transaction data, market prices from exchanges, user engagement metrics, and historical trading volumes.
How can businesses ensure the security of their crypto dashboards?
Businesses can enhance the security of their crypto dashboards by implementing measures such as two-factor authentication, data encryption, and regular security audits to protect sensitive information.
What are some common tools used for creating business intelligence dashboards in crypto?
Common tools for creating business intelligence dashboards in crypto include Formo, Tableau, Power BI, and Looker, which offer various features for data integration, visualization, and analysis.
How do businesses measure the effectiveness of their crypto dashboards?
Effectiveness can be measured through key performance indicators (KPIs) such as user engagement, decision-making speed, and the accuracy of insights derived from the dashboards, along with user satisfaction feedback.
What role does user feedback play in improving crypto business intelligence dashboards?
User feedback is essential for improving dashboards, as it helps identify usability issues, preferred features, and data accuracy, allowing teams to make iterative changes that enhance user experience and decision-making capabilities.
Related Articles
Check out these related articles for more information:
Web3 product analytics tools - Directly relevant for readers seeking specific tools to implement the BI dashboards discussed in the article.
wallet analytics - Provides comprehensive guidance on analyzing wallet data, a core component of crypto BI dashboards.
key performance indicators - Expands on the KPIs mentioned in the article with actionable metrics that drive Web3 growth.
user behavior - Deepens understanding of tracking and analyzing onchain user behavior, a key dashboard use case.
Wallet Intelligence - Explains the wallet intelligence concept that powers many crypto BI dashboard features.


