

Key Takeaways
Wallet retention reveals product-market fit more reliably than TVL or transaction volume because it measures whether users find enough value to return, rather than how much capital or activity a protocol attracts.
Quantitative onchain data shows what users do while qualitative feedback explains why so product teams need both to diagnose root causes of drop-offs rather than just detecting that drop-offs exist.
Each analytics platform serves a distinct product need so teams should match tools to their use case, with general-purpose dashboards, wallet intelligence suites, and compliance tools serving fundamentally different functions.
Use specialized onchain analytics—combining wallet intelligence, real-time monitoring, and privacy-first tools—to track meaningful metrics, attribute user journeys, and optimize Web3 product retention and growth.
Web3 product teams face unique challenges when making data-driven decisions because blockchain apps produce transparent, immutable data that requires specialized interpretation. Onchain analytics platforms read blockchain data directly to provide real-time insights into wallet behavior, transaction patterns, and user engagement across decentralized applications. With the right tools, teams can measure meaningful metrics, understand user journeys, and optimize applications for better retention and growth. This guide reviews top onchain analytics platforms and best practices for implementing data-driven product strategies in Web3.
Define Key Metrics for Onchain Product Analytics
Choosing the right metrics is essential for informed product decisions. Onchain metrics capture user and asset activity recorded on a blockchain—wallet interactions, smart contract calls, and token movements—offering visibility unavailable to traditional web analytics.
Essential metrics:
Active addresses: unique wallets interacting over time (DAU/WAU).
Transaction volume: economic activity and usage intensity.
Wallet retention: return rate after first interaction; reveals product-market fit.
Smart contract interactions: feature popularity and adoption.
Token flows: asset movement and economic patterns.
Gas usage (network fees): user cost and UX friction.
NVT ratio: protocol efficiency by comparing network value to transaction volume.
Metric | Business Question | Use Case |
|---|---|---|
Active Addresses | How many unique users are engaging daily/weekly? | Track DAU/WAU growth |
Transaction Volume | What's the economic activity level? | Measure product usage intensity |
Wallet Retention | Are users coming back? | Optimize onboarding and features |
Smart Contract Interactions | Which features are most popular? | Prioritize development resources |
Token Flows | How do assets move through the ecosystem? | Understand economic patterns |
Gas Usage | What's the user experience cost? | Optimize transaction efficiency |
Prioritize actionable metrics that correlate with user satisfaction and business objectives rather than vanity metrics like raw TVL. Focus on measures that guide product decisions: retention, adoption, and feature usage.
Select the Best Onchain Analytics Tools for Your Product
Onchain analytics platforms aggregate and interpret blockchain data to reveal wallet behaviors and transaction trends, helping teams make data-driven product decisions. The landscape includes general-purpose dashboards, wallet-intelligence suites, and compliance-focused solutions.
Platform | Strengths | Supported Blockchains | Ideal Use Case |
|---|---|---|---|
Formo | Privacy-first, unified analytics | Ethereum, Polygon, BSC, Arbitrum | Product teams needing comprehensive user insights and attribution |
Nansen | Wallet labeling, AI insights | 15+ major chains | Research and institutional analysis |
Dune Analytics | Custom queries, community dashboards | Ethereum, Polygon, Solana | Data analysts and researchers |
Chainalysis | Risk detection, compliance | 100+ blockchains | Enterprise compliance and security |
Elliptic | AML/KYC, investigation tools | Bitcoin, Ethereum, others | Financial institutions and compliance |
When evaluating platforms, consider: privacy-first approaches, wallet intelligence, AI-powered insights, risk detection/compliance, and behavioral segmentation. The right choice depends on technical resources, privacy requirements, and the specific analyses you need.
Formo's Privacy-First Analytics Solution
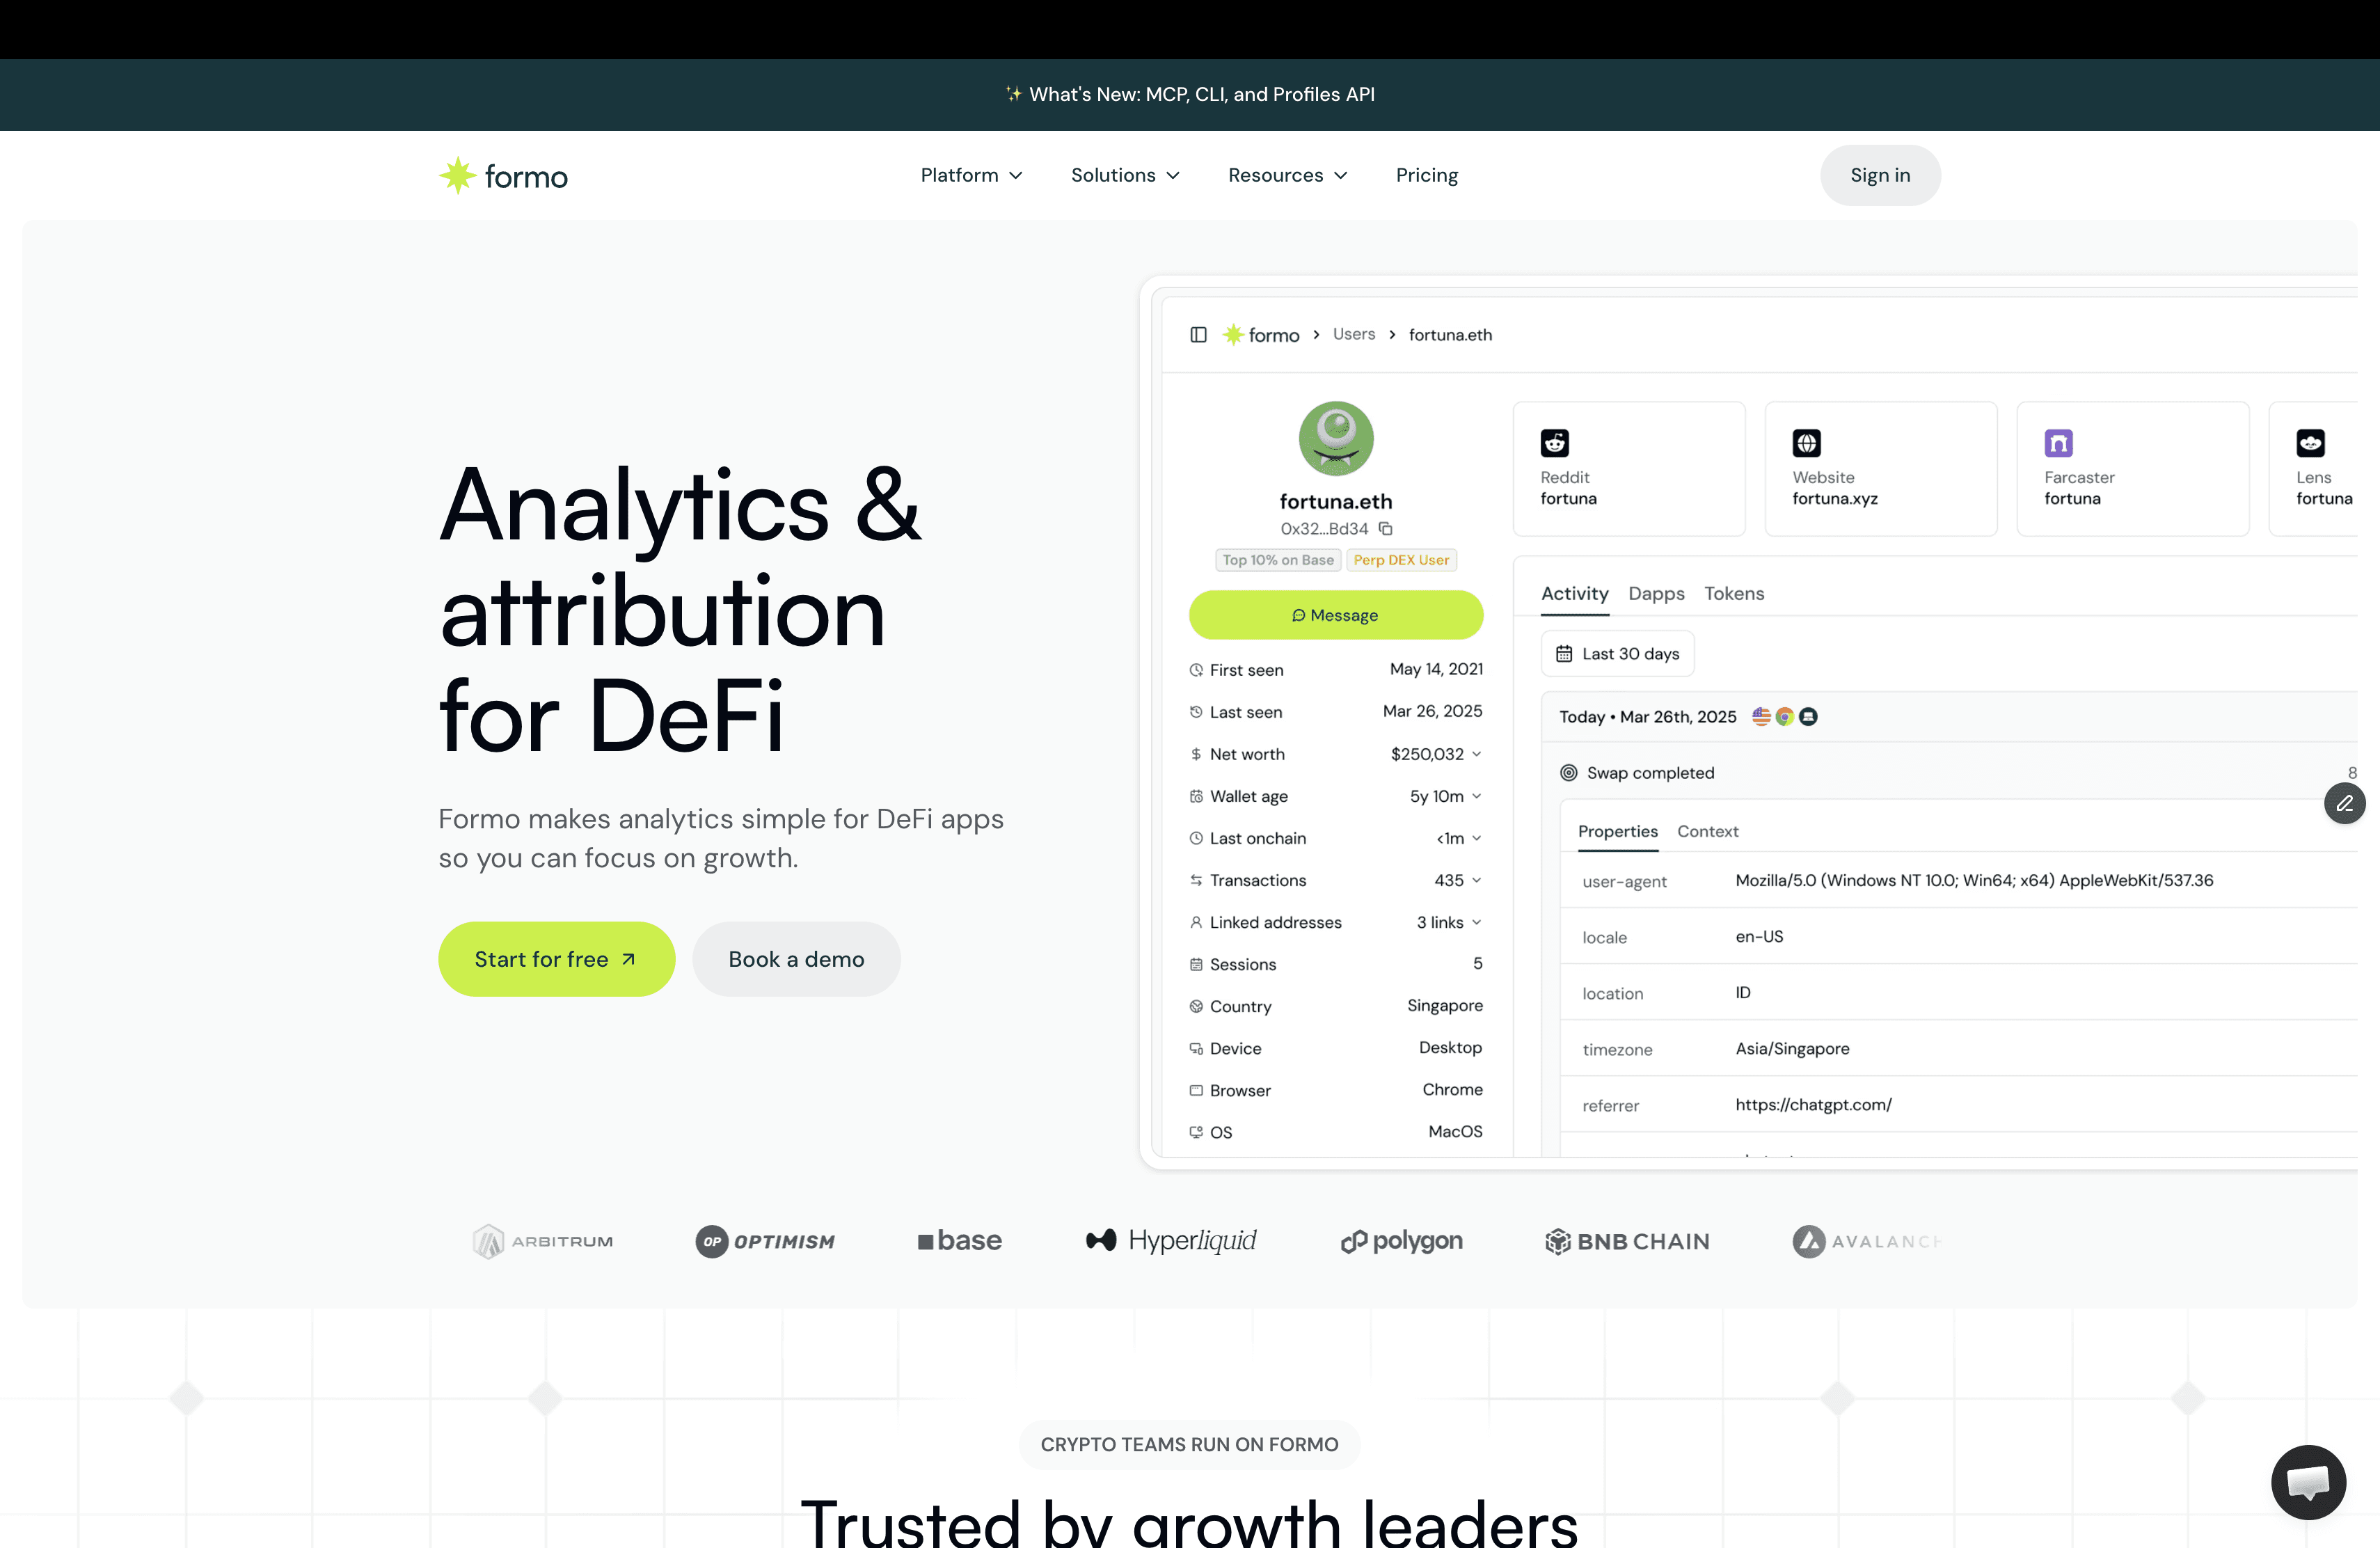
Formo is positioned for privacy-conscious Web3 teams that want unified insights across web and blockchain without invasive tracking or complex integrations. It combines web, product, and onchain analytics into a single dashboard and emphasizes privacy by design.
Formo’s core capabilities:
Real-time attribution: follow user actions from first touch to conversion across web and blockchain.
No third-party cookies: maintain privacy while collecting actionable signals.
Wallet intelligence: segment users by onchain behavior and holdings.
Unified dashboard: view web analytics, product KPIs, and blockchain data together.
Privacy-first SDK: simple integration that respects user privacy.
Advanced segmentation: create cohorts based on wallet activity and engagement.
Formo connects wallet addresses to user journeys, enabling attribution that spans marketing touchpoints through onchain transactions, eliminating data silos and speeding product optimization.
Track and Analyze User Behavior Onchain and Offchain
Behavioral analytics for Web3 combines onchain wallet intelligence (signups, swaps, governance votes, transactions) with offchain product and web events (pageviews, clicks, time on site) to reveal retention patterns and churn signals. The combined data enables comprehensive behavioral segmentation and accurate attribution.
Example conversion attribution workflow:
Track initial touchpoint (campaign landing page).
Monitor engagement (time on page, pages viewed).
Capture wallet connection to the app.
Analyze onchain actions (first transaction, token swaps, feature usage).
Measure retention (return visits and ongoing onchain activity).
Attribute conversion to the original marketing source.
Native unification of onchain and offchain data yields attribution and user insights neither source can provide alone; purely onchain or offchain views miss critical parts of the customer journey.
Implement Real-Time Monitoring for Agile Product Decisions
Real-time monitoring tracks blockchain activity and user behaviors—wallet transactions, smart contract interactions, feature usage—to enable rapid product responses in a fast-moving Web3 environment. Immediate alerts help teams act on emerging issues or opportunities before they escalate.
Monitor and alert on events such as:
Transaction volume spikes (viral adoption or scaling pressure).
Increased failed transactions (contract bugs or network congestion).
New-user onboarding patterns (successful campaigns or friction).
Whale wallet movements (market shifts or strategic interest).
Smart contract upgrade adoption (feature rollout response).
NFT mint participation (community engagement).
Set up actionable alerts that require a response rather than passive notifications. Nansen provides institutional alerting; Formo offers real-time event tracking geared to product teams. Focus alerts on metrics tied to SLA, UX, or growth objectives.
Combine Quantitative Analytics with Qualitative User Feedback
Quantitative data (onchain activity, retention, transaction volumes) shows what users do; qualitative feedback (surveys, AMAs, community posts, interviews) explains why. Combining both gives context to metrics and guides targeted product changes.
Data Type | Information Provided | Collection Methods | Example Insights |
|---|---|---|---|
Quantitative | Usage patterns, retention rates, transaction volumes | Analytics dashboards, blockchain data | 40% of users drop off after first transaction |
Qualitative | User motivations, pain points, feature requests | Surveys, AMAs, Discord feedback | Users find gas fees confusing and unpredictable |
Use analytics to detect anomalies (e.g., post-upgrade drop-offs) and qualitative research to identify root causes (UI confusion, technical issues, or perceived value). Validate hypotheses about low adoption by interviewing users to determine whether discoverability, complexity, or value perception is the problem.
Successful teams build integrated feedback loops: identify patterns with onchain analytics, then deploy qualitative research to uncover user needs and design fixes informed by both data types.
Iterate and Optimize Product Features Based on Insights
Optimize through a systematic loop: monitor metrics, analyze patterns, hypothesize improvements, test on targeted segments, and iterate based on measured results. This ensures changes are validated by user behavior rather than assumptions.
Segmentation and retention:
Segment users by transaction frequency, token holdings, recency, and feature engagement to tailor experiments.
Use retention windows (1-day, 7-day, 30-day) to evaluate onboarding and long-term engagement; users active after 7 days often behave differently than early churners.
Practical approach:
If a key feature has low usage, diagnose whether it’s discoverability, UX complexity, onboarding gaps, or low perceived value.
Run targeted experiments with control groups and measure impact on retention, adoption, and satisfaction.
Iterate quickly, tracking effect size via updated dashboards and refining interventions until metrics improve.
Measure every change and keep control cohorts to ensure observed effects are causal and reproducible.
FAQs About Onchain Analytics Platforms and Web3 Product Analytics
What are the best blockchain analytics platforms for Web3 product teams?
The best blockchain analytics platforms depend on the product team’s goals and workflows. Dune Analytics is widely used for custom blockchain queries and community dashboards, while Nansen focuses on wallet intelligence and AI-driven insights. Chainalysis and Elliptic are designed primarily for compliance, AML, and risk detection. Formo is built for Web3 product teams that need privacy-first analytics combining onchain attribution, wallet intelligence, behavioral segmentation, and unified onchain and offchain dashboards.
What metrics matter most for Web3 product growth?
The most important Web3 product analytics metrics include wallet retention, active addresses, transaction volume, smart contract interactions, token flows, and gas usage. Wallet retention is often more valuable than raw TVL because it measures whether users continue returning after their first interaction. Smart contract interactions help identify feature adoption, while gas usage highlights user experience friction.
Why is wallet retention more important than TVL in Web3 analytics?
Wallet retention measures whether users return after their first interaction, making it a stronger indicator of product-market fit than TVL or transaction volume alone. TVL can increase because of short-term incentives or temporary capital inflows, while retention reflects sustained user value and long-term engagement.
How do onchain analytics tools improve user retention?
Onchain analytics tools improve retention by tracking wallet activity, feature engagement, transaction behavior, and churn patterns over time. Product teams can identify at-risk user segments, analyze where drop-offs occur, and run targeted onboarding or feature experiments to improve long-term engagement.
How do Web3 teams combine onchain and offchain analytics?
Web3 teams combine onchain analytics such as wallet activity, swaps, governance participation, and smart contract interactions with offchain analytics like pageviews, clicks, and session engagement. This unified approach provides end-to-end attribution from acquisition source to onchain conversion and helps teams understand complete user journeys.
What is wallet-level segmentation in blockchain analytics?
Wallet-level segmentation groups users based on behaviors such as transaction frequency, token balances, recency, feature usage, or engagement patterns. Product teams use these cohorts to personalize onboarding, optimize messaging, and run experiments targeted to specific user groups.
How can Web3 teams monitor blockchain activity in real time?
Web3 teams can monitor blockchain activity in real time by tracking transaction spikes, failed transactions, onboarding patterns, whale wallet movements, feature adoption, and smart contract interactions. Real-time monitoring allows teams to respond quickly to scaling issues, product friction, or growth opportunities.
What are the best practices for privacy-first onchain analytics?
Privacy-first onchain analytics platforms avoid invasive tracking and third-party cookies while still providing actionable behavioral insights. Best practices include analyzing pseudonymous wallet activity, aggregating user behavior instead of storing personally identifiable information, and combining onchain and offchain signals in privacy-conscious ways.
What is the difference between Dune Analytics, Nansen, Chainalysis, and Formo?
Dune Analytics focuses on custom blockchain queries and community dashboards for analysts and researchers. Nansen specializes in wallet labeling, AI insights, and institutional-grade blockchain intelligence. Chainalysis is designed for compliance, AML, and risk detection across many blockchains. Formo focuses on privacy-first product analytics that combine onchain attribution, wallet intelligence, and web analytics into a unified dashboard.
How should Web3 teams optimize product features using analytics?
Web3 teams should optimize features through an iterative process that combines analytics, segmentation, experimentation, and retention analysis. Teams can identify low-adoption features, diagnose causes such as discoverability or onboarding friction, test improvements on targeted cohorts, and measure results using retention and engagement metrics.


