

Key Takeaways
Marketing metrics serve as a growth compass: when chosen around strategic goals rather than vanity numbers, they reveal where to invest and what to cut.
Outputs are not outcomes. Publishing content or launching campaigns delivers no value unless they produce measurable business results: wallet retention, transaction revenue, or protocol active usage.
Avoid metric traps by connecting every KPI to a strategic priority. Validate your North Star Metric against actual onchain behaviour and always interpret results in the context of concurrent campaigns or market conditions.
Web3 requires a new measurement playbook: wallet intelligence, onchain activity tracking, and privacy-first attribution replace cookies and centralised analytics tools that cannot see wallet-level behaviour.
A full-spectrum Web3 dashboard covers six areas: acquisition (cost per wallet, first-transaction rate), engagement (feature adoption, session depth), retention (wallet return rate, 30/60/90-day cohorts), DeFi health (TVL, liquidity depth), segmentation (wallet scores, wallet labels), and community (DAO participation rate).
In Web3, growth is about understanding how users discover, engage with, and stay loyal to your dApp. The best teams don’t just track what’s happening; they connect these insights with real onchain behavior to drive data-driven decisions.
This guide breaks down the core Web3 marketing metrics—from acquisition and retention to DeFi performance and product analytics—along with practical action items to help you track, interpret, and improve them.

What Are Marketing Metrics?
Think of marketing measurement as keeping score. Marketing metrics are the actual numbers on the scoreboard—NPS, conversion rate, Customer Lifetime Value (CLV), you name it. They’re not just “stats for stats’ sake.” They’re the proof of what’s working, what’s not, and where you’re headed.
The Most Common Marketing Metric Traps (and How to Avoid Them)
Marketers often fall into the same marketing metrics mistakes—tracking numbers without context, misaligning goals, or chasing the wrong “north star.” Many metrics are influenced by sales, customer success, or external factors, so you can’t analyze them in isolation. Context is everything. Here’s how to avoid the biggest pitfalls:
1. Confusing Outputs With Outcomes
Outputs are the things you create—emails, blog posts, and landing pages. Outcomes are the results those outputs should deliver—lower churn, higher revenue, stronger engagement. If your content and campaigns aren’t producing measurable outcomes, they’re just busywork.
2. Ignoring the Strategic Link
Every metric should tie directly to your business objectives. Not vanity goals. Not “make the report look good” goals. When budgets tighten, the metrics that align with strategic priorities position marketing as a growth driver.
3. Picking the Wrong North Star Metric
If your main goal is revenue growth, focusing only on conversion rate optimization might not be enough. For example, a higher conversion rate won’t matter if traffic drops and revenue stalls. Test your north star: If it improves but nothing else changes, will it still help you hit your target? If not, you need a different or supporting metric.
Why Web3 Needs a New Marketing Metrics Playbook
In Web2, marketers rely on cookies, email IDs, and traditional analytics platforms. In Web3, you can’t depend on those. This means your marketing metrics dashboard needs to merge traditional KPIs with onchain insights, tracking not only how users arrive but also how they transact, hold assets, and engage with your onchain apps over time.
A. Core Marketing Metrics
1. User Acquisition Metrics
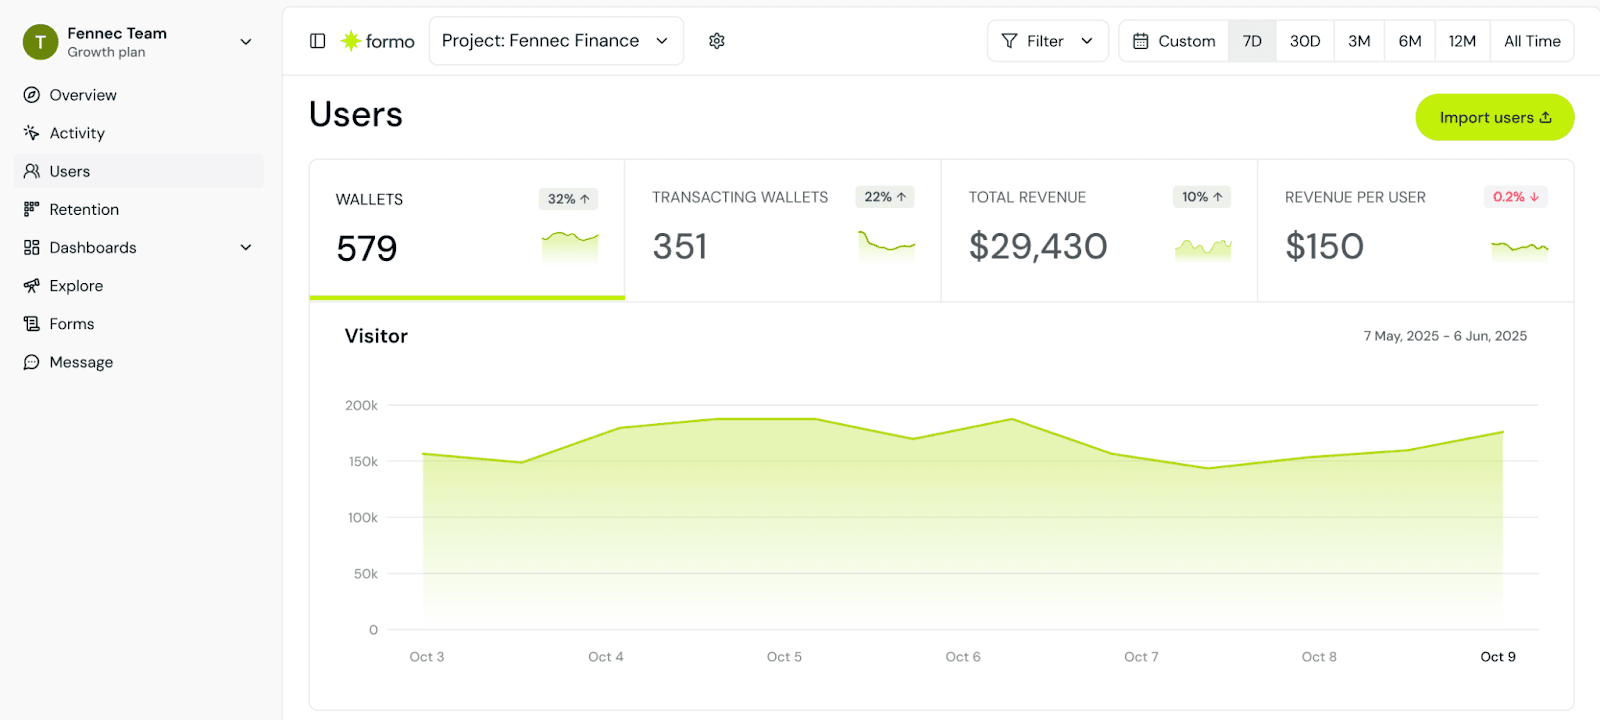
Acquisition metrics measure how effectively you attract new users—and how much it costs to do so.
Metric | Description | Action Items |
Website Traffic | Total visits, unique visitors, traffic sources. | Available on the overview page. |
Wallets Connected | # of new wallets connected to your platform. | Split autodetected vs. connected wallets for cleaner reporting. |
Conversion Rate | % of visitors who connect a wallet and take their first action. | Use funnels to track conversions. |
Referral Users | # of new users acquired via referral. | Build custom charts grouped by referral source. |
Cost per Acquisition (CPA) | Marketing spend per successful wallet connection. | Use CPA calculator; add funnel filters. |
Campaign ROI | Return on spend from ads, influencers, or airdrops. | Segment funnels by campaign and add custom charts. |
Why it matters:
Tracking acquisition metrics ensures your growth budget drives real, connected wallets—not just empty page views.
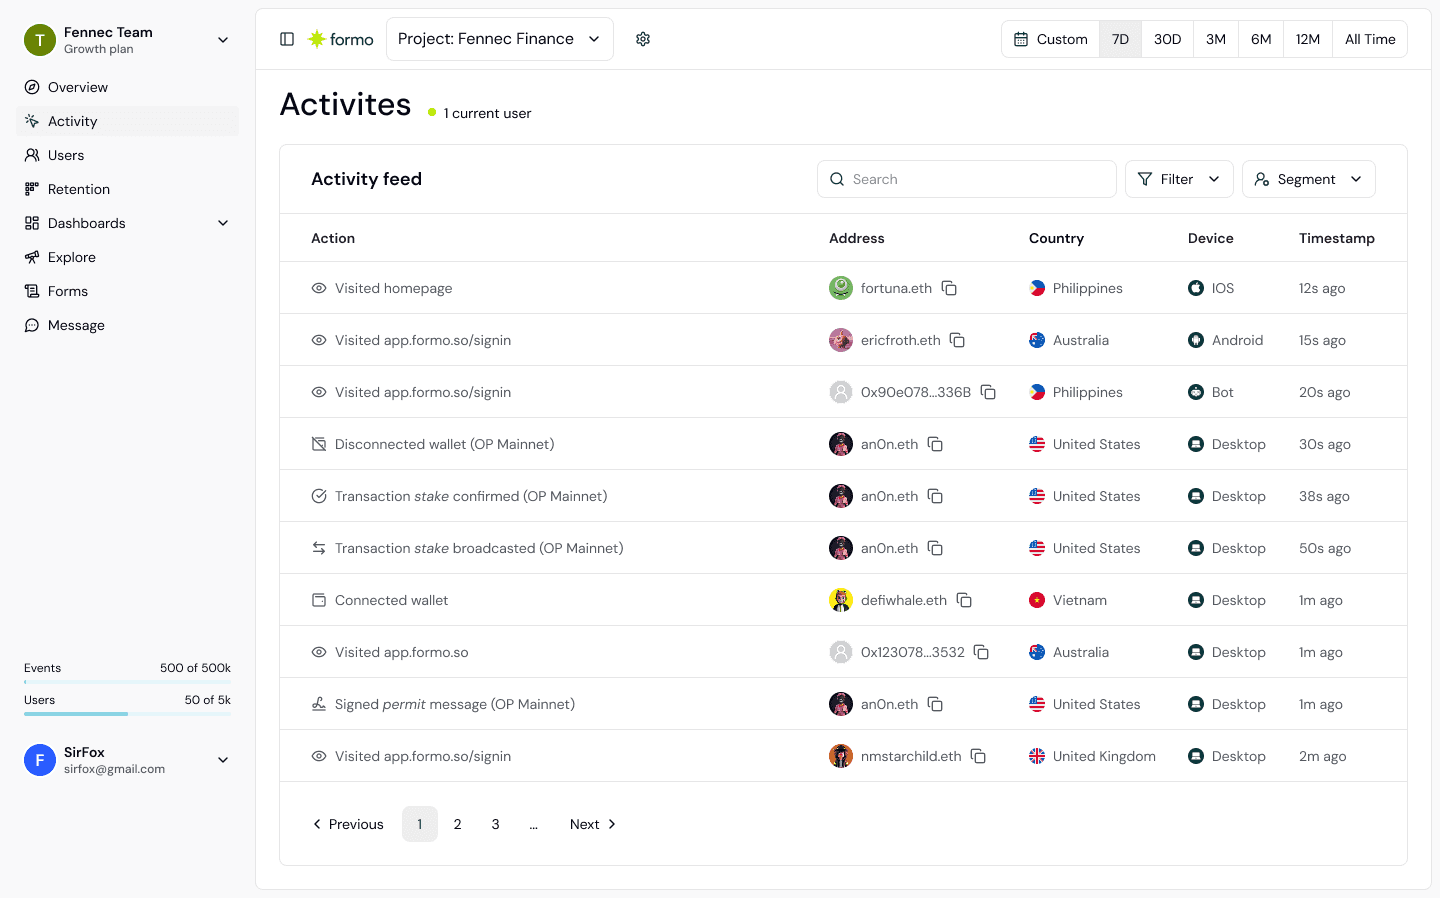
2. User Engagement Metrics
Engagement metrics show how actively users interact with your platform.
Metric | Description | Action Items |
Daily, weekly, and monthly active wallets. | Add dedicated charts for all three. | |
Feature Usage Breakdown | % of users using features like lending, borrowing, and staking. | Track via top events in analytics. |
Session Length | Average time spent per visit. | Available on the overview page. |
Feature Transition Rate | % of users moving between features (e.g., borrow → stake). | Measure using funnels. |
Referral Activity | Avg. invites per user, depth of referral tiers. | Create breakdown charts by referral value. |
Why it matters:
High engagement indicates product-market fit and user satisfaction—key drivers of organic growth.
3. Retention & Loyalty Metrics
Retention shows whether your users stick around—or drop off after first contact.
Metric | Description | Action Items |
User Retention (Day 1 / 7 / 30) | % of users returning after first wallet connect. | Track wallet-only retention. |
% of inactive users. | Monitor on retention page. | |
Repeat Usage Rate | How often users repeat actions. | Label power users and track advanced funnels. |
Wallet Age Distribution | How long have wallets been active on your platform? | Add user age breakdown charts. |
Why it matters:
Retention is a stronger growth signal than acquisition—especially in Web3, where wallet switching is easy.
B. DeFi-Specific Performance Metrics
If you’re running a DeFi protocol, financial metrics directly reflect product health.
4. TVL and Volume Metrics
Metric | Description | Action Items |
Total Value Locked (TVL) | Total funds across lending, staking, LP, and farming. | Add dedicated TVL tracking. |
TVL by Feature | TVL per product area. | Build breakdown charts. |
Borrowed Volume | Total borrowed assets over time. | Subscribe to borrow events. |
Swap Volume | Value of swap transactions over time. | Track revenue from contract events. |
APY Volatility | Fluctuations in yields. | Add historical APY charts. |
APY vs. TVL Correlation | See if high APY drives liquidity inflows. | Compare APY and TVL trends. |
5. User Financial Behavior
Metric | Description | Action Items |
Average Deposit Size | Per feature (lend, stake, LP). | Track via deposit event subscriptions. |
Borrow Utilization Rate | % of supplied assets being borrowed. | Extend charts to include API data. |
Liquidation Rate | Frequency of position liquidations. | Subscribe to liquidation events. |
Why it matters:
Financial metrics give you early warning signs of liquidity risks or underperforming features.
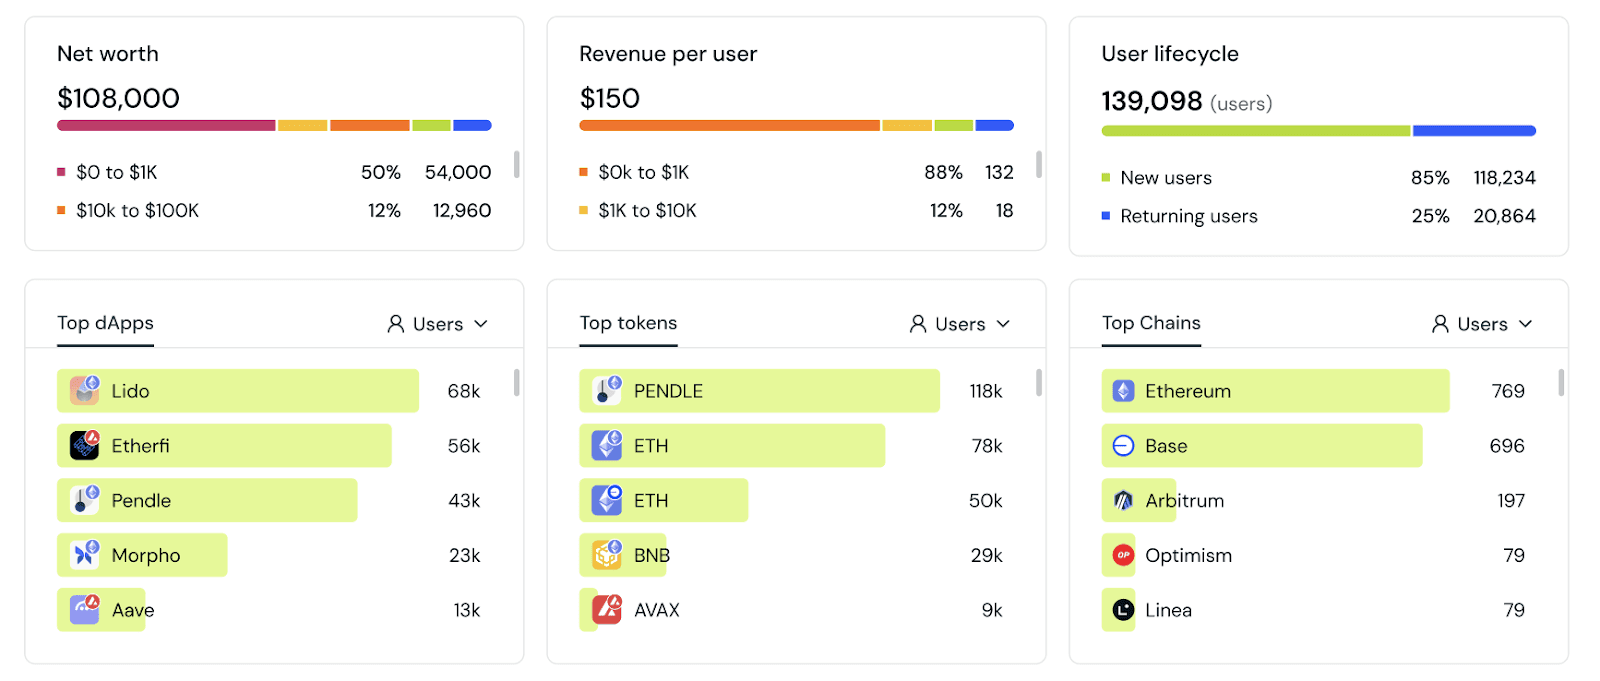
C. User Segmentation Metrics
Understanding who your users are unlocks more precise marketing.
Metric | Description | Action Items |
User Type Distribution | % traders, lenders, stakers. | Enable wallet labeling in profiles. |
Asset Profile | Avg. holdings per wallet. | Add wallet profiling pipeline. |
Volume Tiers | User groups by transaction volume. | Build revenue breakdown charts. |
Feature Journey Mapping | Common paths users take. | Add path analysis tools. |
Why it matters:
Segmentation powers hyper-personalized campaigns—essential for converting casual wallets into power users.
D. Campaign & Community Metrics
Your community is your growth engine in Web3.
Metric | Description | Action Items |
Campaign Conversion Rate | % of campaign participants using your features. | Segment funnels by UTM. |
Social Growth | Followers and community size. | Integrate with third-party tools. |
Engagement Rate | Likes, replies, click-throughs. | Measure via platform analytics. |
Sentiment Analysis | Community tone over time. | Integrate third-party monitoring. |
Tracking these metrics is only the first step. The real value comes from connecting marketing data with onchain activity, so you can see not just who arrived, but who stayed, transacted, and grew your product’s value.
By building a comprehensive Web3 marketing metrics dashboard, you can:
Identify high-value wallet segments
Optimize acquisition spend
Improve retention with targeted engagement
Maximize onchain app performance through data-driven decisions
With a sea of marketing metrics out there, mindset matters more than ever. The way you approach marketing is what cuts through the noise, shows you what truly moves the needle, and helps you execute with impact. In upcoming articles, we’ll cover how to set up these web3 product metrics using Formo and custom analytics pipelines—so you can move from raw data to real growth.
Follow Formo on LinkedIn and X for more onchain growth insights!
Read more:
Mastering Web3 Marketing Attribution Analytics: A Complete Guide
Web3 Marketing and Web2 Marketing: What are the differences?
FAQs
What are the essential Web3 marketing metrics for a growth dashboard?
A Web3 marketing metrics dashboard should track both standard funnel KPIs and unique on-chain signals. Key categories include acquisition (website traffic), activation (wallet connections), and retention (daily active users). You also need to monitor revenue through transaction volume and referrals via community growth. Integrating on-chain data like new wallet creation, smart contract interactions, and Total Value Locked (TVL) is essential for a complete view of protocol health and user engagement.
How can I combine on-chain and off-chain data in one marketing dashboard?
To get a full view of the user journey, you need to connect off-chain and on-chain activities in one place. Start by tracking traditional off-chain metrics like web traffic and social engagement using standard analytics tools. Then, pull in on-chain KPIs from blockchain indexers, such as wallet connections, smart contract calls, and TVL. This blend lets you trace a user’s path from a social post to an on-chain action, giving you a clear picture of crypto user activation.
How can a Web3 dashboard measure user activation and retention?
A Web3 dashboard measures activation and retention by grouping users into cohorts based on on-chain events. You can define these cohorts by the date of their wallet creation, first transaction, or initial app use. Key activation milestones are actions like connecting a wallet or making a first contract call. To track retention, analyze these cohorts over time to see activity rates for week 1, week 4, or a rolling 30-day period.
How does marketing attribution work in Web3 for onchain conversions?
Web3 attribution connects off-chain marketing activities to on-chain results. You can track this journey using tools like UTM parameters, referral codes, or signature-based tracking to link an initial touchpoint to a conversion like a swap or stake. While challenges like privacy and multi-wallet use exist, models like first-touch or last-touch attribution still offer valuable insights. This helps you see which channels drive on-chain growth and where to allocate your budget.
What is the best way to structure a Web3 growth dashboard for my team?
Structure your dashboard around a single north-star metric that captures your project’s main value, like weekly active wallets or Total Value Locked (TVL). Build supporting KPIs based on your growth stage, such as activation for new projects or retention for mature ones. A shared dashboard gives marketing, product, and community teams a single source of truth to align on goals and measure progress together.


