Changelog
Changelog
We ship new features, fixes, and improvements to Formo every week
Here are this week's highlights:
Multi-Anchor Flows
Compare Previous Period
Ask AI Dashboard Creation
Edit Dashboard Layout
Move Charts
Duplicate Charts
SQL: Dynamic Date Variables
SQL: Price Oracle Functions
Formo CLI
Improvements and Fixes
Multi-Anchor Flows
Flow charts now support multiple anchor steps, letting you visualize how users flow through several key events rather than just one.
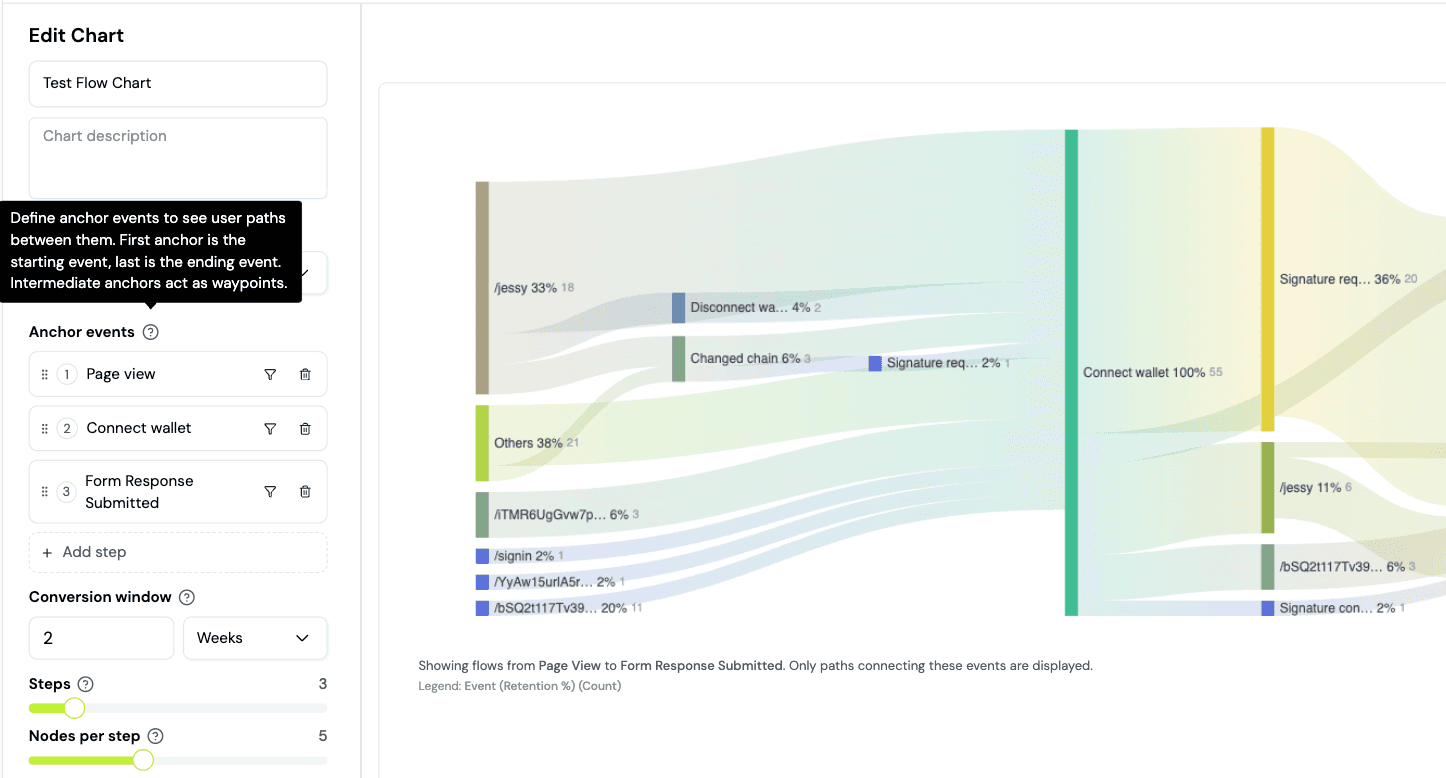
This gives you a more complete picture of the user journey across your DeFi app.
Compare Previous Period
You can now compare data with a previous time period on the Overview page to compare performance across consecutive periods.
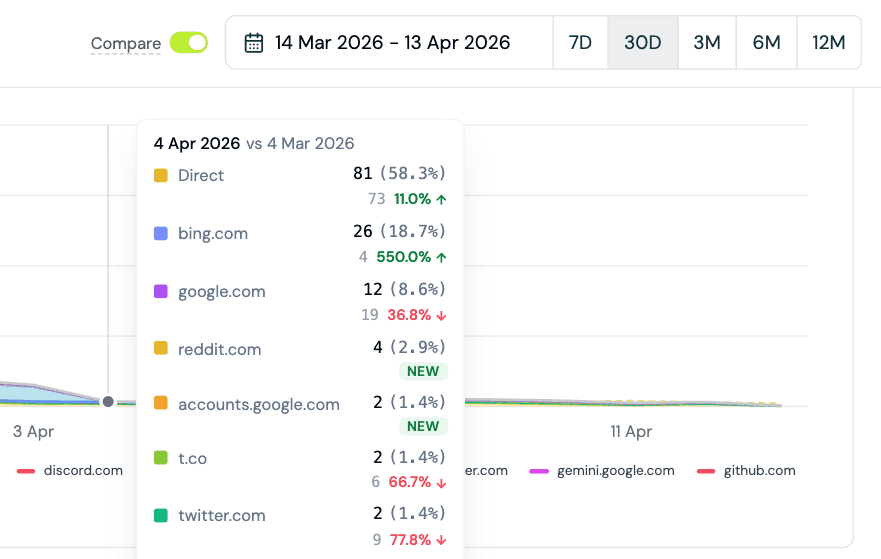
For example, when 30D is selected, all charts on the overview page will compare with the previous 30D period.
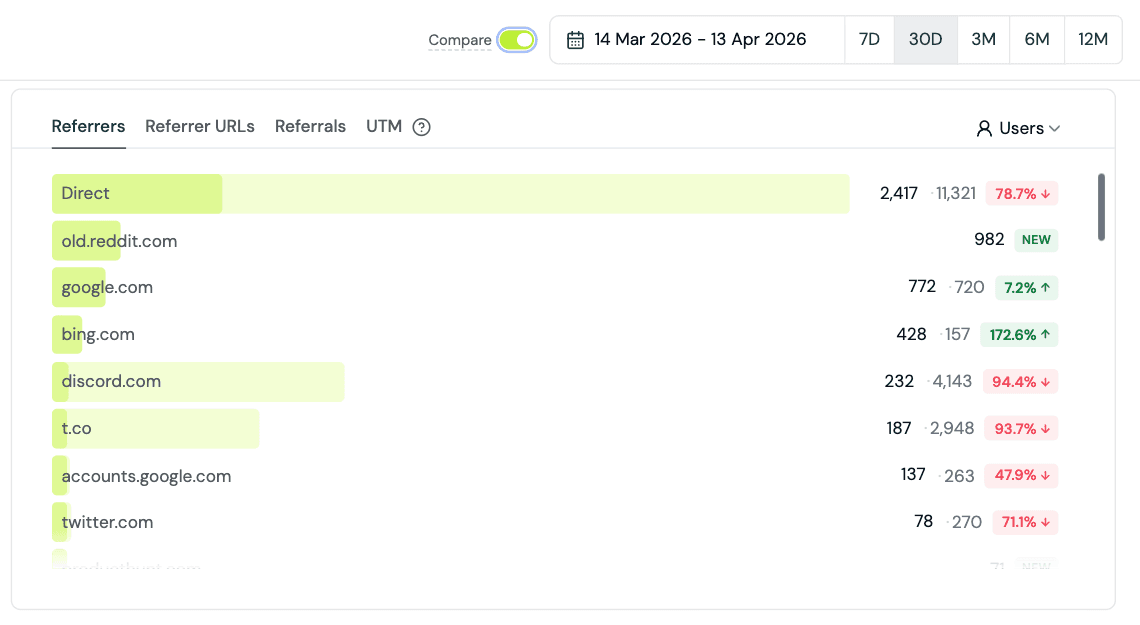
This makes it easy to spot trends, measure the impact of changes, and understand whether metrics are improving or declining relative to a prior window.
Ask AI Dashboard Creation
Ask AI can now create entire dashboards for you from a prompt. Describe what you want to track and the AI will generate a complete dashboard with relevant charts, saving you the time of building each chart manually.
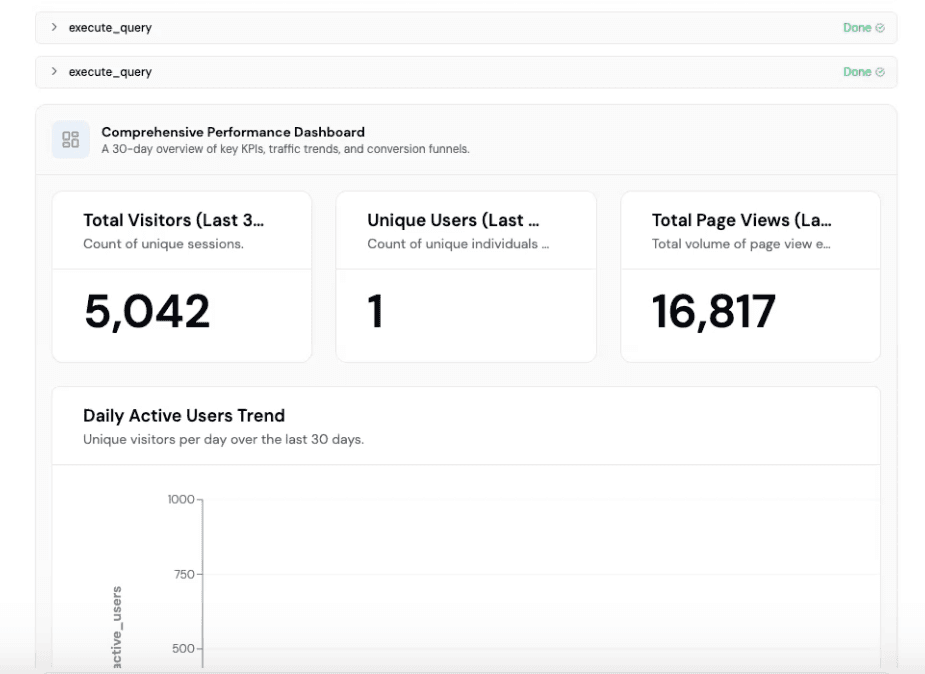
You can then save the charts as a new dashboard.
Reorder Charts
You can now reorder charts on your custom dashboard.
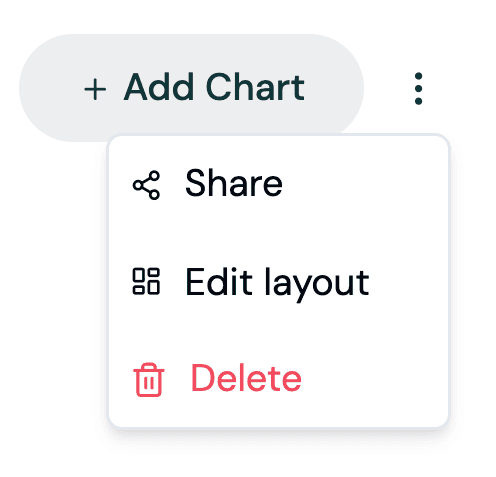
Freely rearrange your layout to put the most important metrics front and center.
Duplicate Charts
You can now duplicate any chart in your custom dashboard.
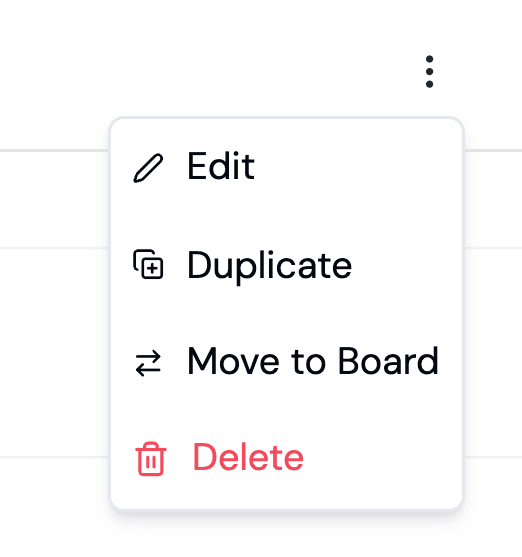
This saves time when you want to create variations of an existing chart with different filters, time ranges, or breakdowns.
Move Charts Between Dashboards
Charts can now be moved from one dashboard to another.
This makes it easy to reorganize your dashboards without having to recreate charts from scratch.
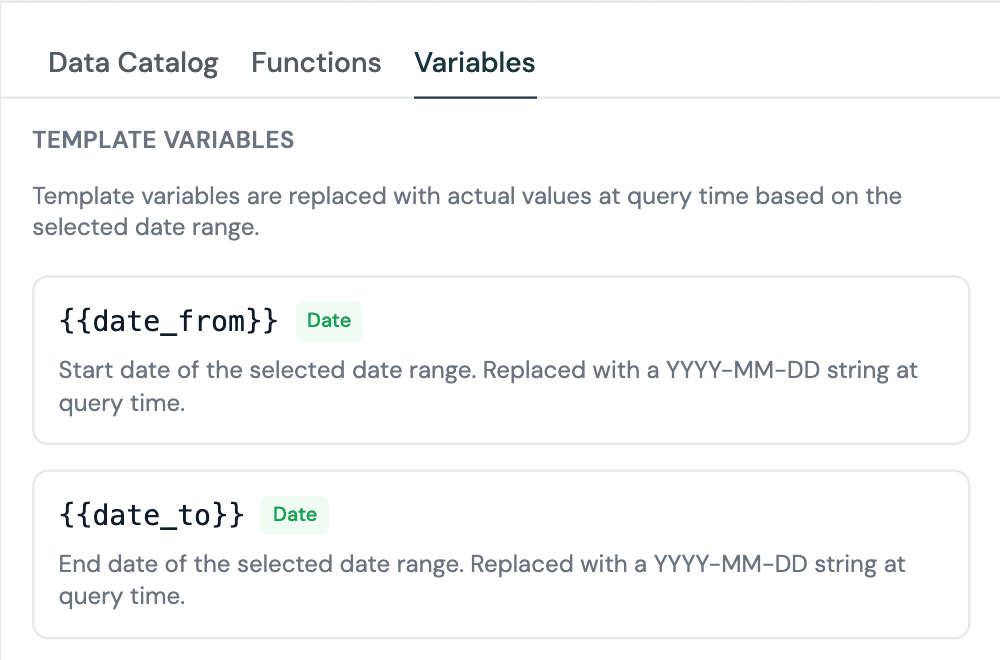
SQL: Dynamic Date Variables
Charts now support dynamic date range filtering through new template variables in your SQL queries.
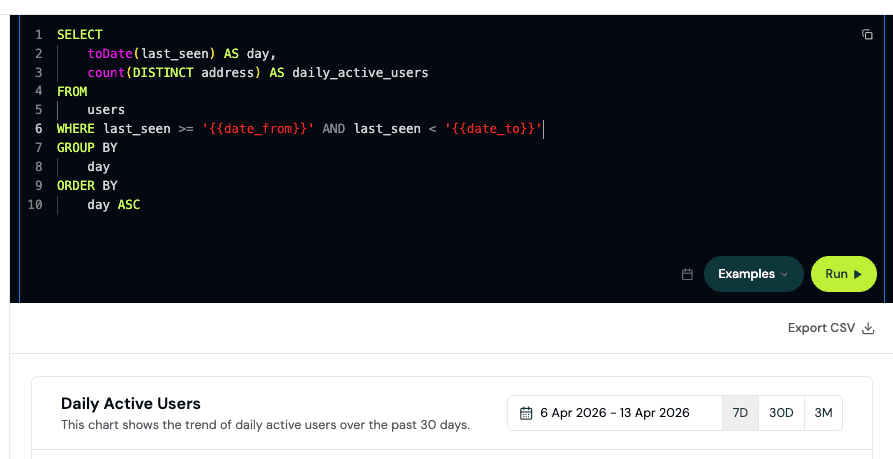
Instead of hardcoding date ranges, you can set charts to automatically adjust based on a shared date picker, making dashboards more interactive and easier to explore across different time windows.
SQL: Price Oracle Functions
You can now use a price oracle function in your SQL queries.
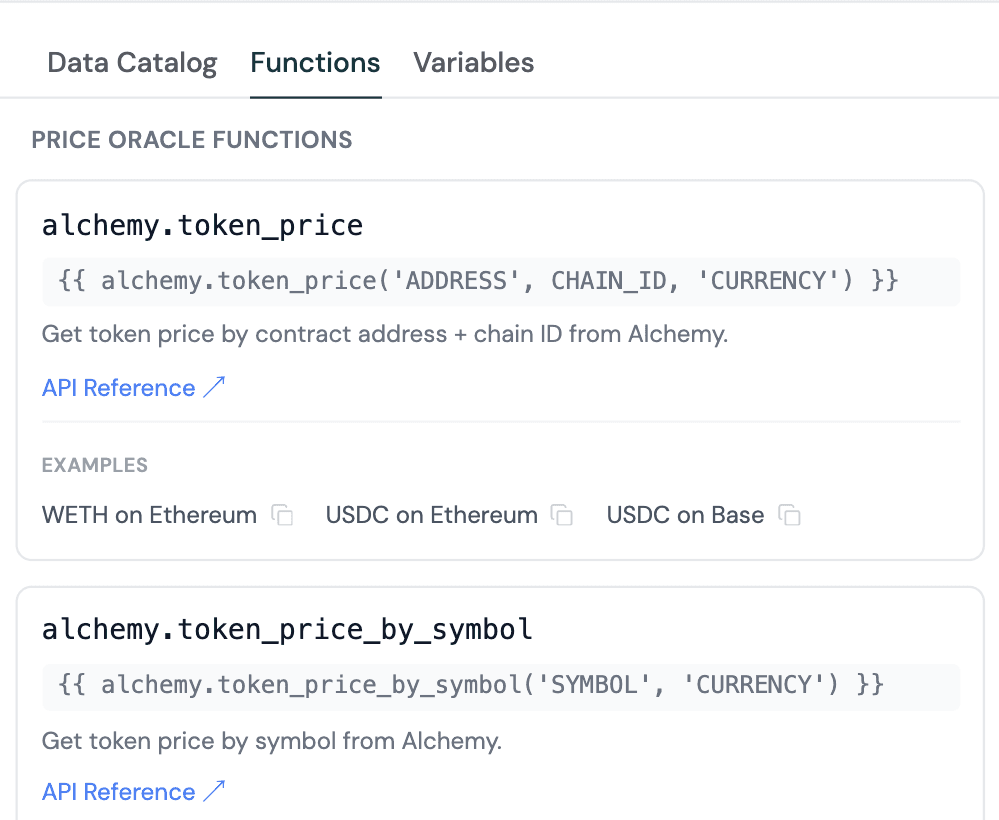
Convert token amounts to USD values directly in your analytics queries without needing to join external price data manually.
Formo CLI
The Formo CLI (@formo/cli) is now available. The CLI gives you an agent-friendly terminal-based interface for working with Formo, from querying data to creating charts and more.
Install it via npm to get started.
Improvements and Fixes
Added Solana support to profile search and fetch endpoints
Added how-to guides to the docs such as How to Build Conversion Funnels
Added CLI documentation
Added a Tempo Accounts SDK example project.
Added SDK security documentation with architecture, data collection, and supply chain security measures
Added AI insights citations showing the data, queries, and methodology of each insight
Improved team invite validation and error handling
Unified mobile screen events with web page views in the React Native SDK, so charts and attribution work seamlessly across web and mobile
Fixed stale charts shown on custom dashboard after updating a chart
Authorization checks and security improvements
Other performance improvements and UI fixes
Share this on
Crypto analytics that drive growth
Formo helps you define, measure, and drive impact onchain in less time.
Platform