

Key Takeaways
Conversion rate measures the percentage of visitors who complete a desired action, from newsletter sign-ups to NFT mints.
Tracking conversion rates identifies bottlenecks, improves campaigns, and maximizes ROI.
A “good” conversion rate varies by channel: 2–5% for websites, 3–8% for emails, 10%+ for targeted landing pages.
CRO strategies like A/B testing, simplifying funnels, and strengthening CTAs can dramatically boost conversions.
Traffic in crypto doesn’t move the needle. What matters is what people do after they land on your site, app, or landing page. This is even more true in web3, where vanity metrics are easily gamed.
Conversion rate is the heartbeat metric that tells you how well your audience is moving from “just looking” to taking the action you care about whether that’s making a transaction or creating an account. A high conversion rate means you’re not just attracting attention, you’re converting interest into outcomes. Let’s dive into the specifics.
What Is a Conversion Rate?
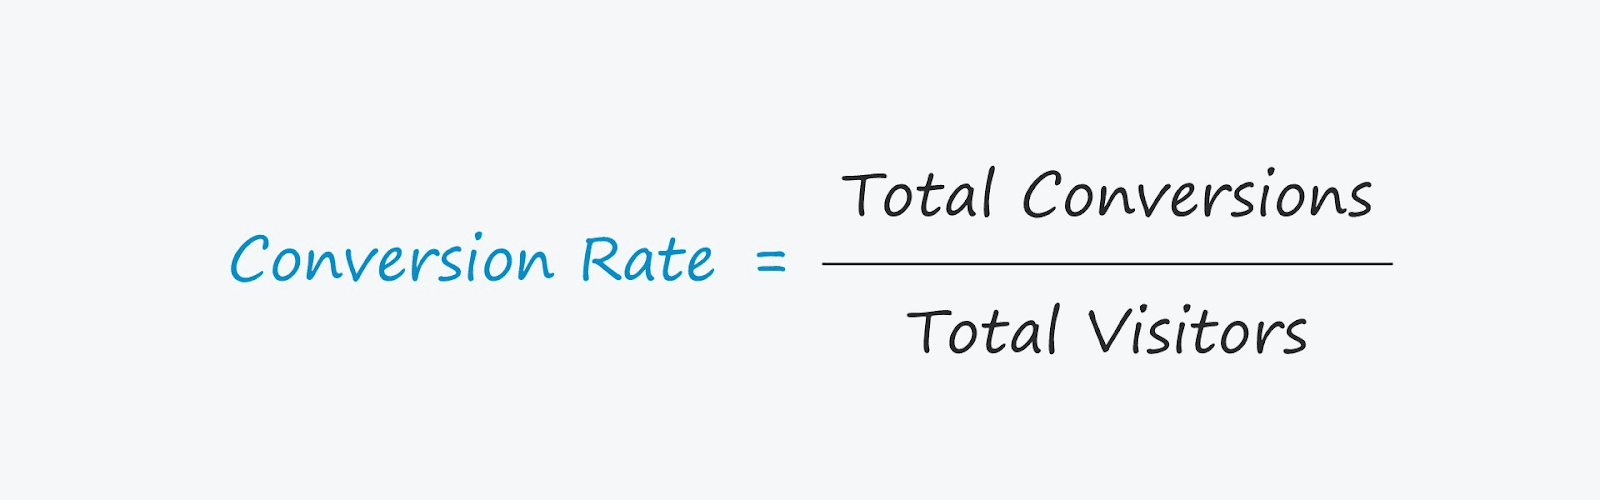
Conversion rate is the percentage of visitors who complete a desired action out of the total visitors to your website, app, or campaign page.
A “conversion” could be anything you define as a success, including:
Buying a product
Registering for an event
Downloading your app
Subscribing to a newsletter
Completing a blockchain transaction
If 100 people visit your landing page and 7 of them complete the action you want, your conversion rate is 7%.
Why Conversion Rate Matters
Tracking conversion rate is like having a health check-up for your marketing and product performance. Here’s why it’s critical:
Shows campaign effectiveness – If your ads or outreach are working, the conversion rate tells you how well.
Guides budget allocation – Put more resources into what’s converting, not just what’s getting clicks.
Reveals audience behavior –Spot bottlenecks in the journey and fix them before they cost you revenue.
Drives ROI – Higher conversion rates mean you get more results without necessarily spending more.
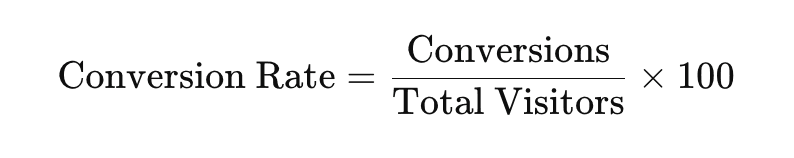
How to Calculate Conversion Rate
Formula:
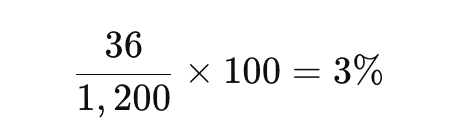
Example:
Total visitors: 1,200
Conversions: 36
For ads, you can also calculate conversion rate based on clicks instead of total impressions, depending on what stage you’re optimizing for.
What’s a Good Conversion Rate?
The honest answer: it depends. Your industry, audience, and traffic source all shape what “good” looks like.
Across industries (websites): The average conversion rate tends to land between 2–5%. That means that out of 100 visitors, 2–5 will take the desired action.
Email campaigns: A well-optimized email can yield conversion rates of 3–8%, with higher rates if your list is segmented and the offer is relevant.
Landing pages: With the right targeting, irresistible offer, and minimal distractions, you can break into double-digit territory (10%+).
If your current rate is 2.3%, don’t obsess over the industry average — aim for 3%, then 3.5%, and keep climbing. Every incremental lift compounds over time into serious revenue gains.
How to Improve Your Conversion Rate (CRO)
Conversion Rate Optimization (CRO) is about making your pages, campaigns, or funnels work harder — turning more visitors into sign-ups, customers, or whatever “success” means for you.
Here’s your 7-step CRO toolkit:
Run A/B Tests
Test one element at a time — headline, CTA, layout, form length. Small changes can make a big difference. For example, a button color shift or a reworded headline could boost conversions by 10% or more.
Simplify Your Funnel
Cut unnecessary steps in your funnel. Every extra click is a chance for drop-off. Use funnel analytics to spot where users abandon the journey — then ask yourself: Can the user reach the goal in fewer steps?
Strengthen Your CTAs
Make calls-to-action clear, urgent, and benefit-focused. Swap “Submit” for “Get My Free Trial” or “Start Earning Today.”
Use Social Proof
People trust people. Add testimonials, user counts, reviews, case studies, or trust badges. This reduces hesitation and builds credibility instantly.
Personalize the Experience
Tailor content, offers, and messaging based on user behavior, traffic source, or past interactions. Example: Show different CTAs for new vs. returning visitors.
Optimize for Mobile
More than half of your traffic is probably mobile. If the page is slow, the form is tiny, or the buttons are hard to tap — you’re losing customers.
Create Targeted Landing Pages
Match each campaign to a dedicated page. If an ad promises “Web3 Analytics in 1 Click,” don’t send people to a generic homepage — send them straight to the relevant feature page.
How to Analyze Feature Usage
Great feature usage analysis goes beyond counting clicks. It blends hard numbers with human context so you understand why users behave the way they do. Here’s how to break it down:
1. Segment Your Users
Don’t just look at overall adoption — slice the data by user type. In Web3, that might mean:
New vs. returning wallets to see how quickly new users discover key features.
High-value vs. low-value users to understand which features your top spenders or most active wallets rely on.
2. Compare Across Features
Rank your features by adoption rate and engagement time. This helps surface your “power features” — the ones that keep people engaged longest — and highlight features that need extra visibility or improvement.
3. Monitor Trends Over Time
Track usage patterns weekly or monthly. Spikes could signal a successful campaign or seasonal demand. Dips might point to UX friction or feature fatigue. Plateaus? That’s your cue to refresh or innovate.
4. Tie Usage to Outcomes
Engagement is nice, but impact is better. The best features aren’t just popular — they directly influence conversions, onchain transactions, or retention. Always link usage metrics back to the business or growth goals they serve.
How to Track Conversion Rate with Formo
Tracking conversion rates in Web3 doesn’t have to be complicated. With Formo, you can gain clear insights into how users interact with your product, from wallet actions to campaign responses, all in one place. Here’s how to get started:
Step 1: Create a Formo Account
Sign up on Formo to access your dashboard and start tracking key user actions. Your account is the hub for collecting and analyzing all conversion data.
Step 2: Install the Formo SDK
Add Formo’s lightweight SDK to your website or dApp. Just one line of code is all it takes to start tracking conversion events, user interactions, and wallet activity.
<script
src="https://cdn.formo.so/analytics@latest"
defer
onload="
window.formofy('<YOUR_WRITE_KEY>', {
ready: function(formo) {
formo.identify();
}
});
"
></script>
This script automatically captures onchain events and user behaviors, giving you a complete view of conversions.
Step 3: Validate Your Data
Check that your events are properly tracked in Formo’s dashboard. Make sure clicks, signups, purchases, or wallet interactions are being recorded correctly. Accurate data ensures your conversion insights are reliable.
Step 4: Define Conversion Events
Use Formo’s visual event labeling to mark the actions that matter most — like minting an NFT, joining a waitlist, or completing a purchase. Each event becomes a conversion you can track and analyze.
Step 5: Visualize Conversion Data
Create charts and dashboards in Formo to monitor your conversion rates over time. Compare campaigns, understand user behavior, and spot opportunities to optimize funnels and increase ROI.
By measuring, analyzing, and improving conversion rates, you’re building a data-driven foundation for sustainable user growth. Pairing conversion rate tracking with onchain analytics ensures you know who your most valuable users are, where they came from, and why they convert. With Formo, you can go beyond vanity tracking to deeply understand wallet behavior, campaign impact, and long-term engagement — turning every conversion into a clear signal for data-driven marketing decisions.
Read more:
Follow Formo on LinkedIn and X for more onchain growth insights!
FAQs
1. What is a conversion rate?
Conversion rate is the percentage of visitors who complete a desired action on your website, app, or campaign page. This could include making a purchase, signing up for a newsletter, filling out a form, or completing an onchain transaction. It’s a key metric for measuring how effectively your traffic turns into meaningful results.
2. Why does conversion rate matter?
Conversion rate reveals the effectiveness of your marketing campaigns and product experience. A higher conversion rate means more visitors take the actions you care about, which leads to better ROI, reduced wasted spend, and clearer insights into user behavior.
3. How do I calculate conversion rate?
The formula is straightforward:
Example: If 36 people complete a desired action out of 1,200 visitors, your conversion rate is:
For ad campaigns, you can also calculate conversion rate based on clicks instead of total impressions, depending on the stage of the funnel you are optimizing.
4. What is a good conversion rate?
There’s no one-size-fits-all answer. Conversion benchmarks vary by industry and channel:
Websites: 2–5% average
Email campaigns: 3–8% average
Highly targeted landing pages: 10%+
Instead of comparing to averages, focus on improving your baseline step by step. Even small incremental lifts compound into significant results over time.
5. How can I improve conversion rates?
Conversion Rate Optimization (CRO) strategies can help you turn more visitors into customers or leads:
Run A/B tests: Experiment with headlines, CTAs, layouts, and form lengths.
Simplify your funnel: Remove unnecessary steps to reduce drop-offs.
Strengthen CTAs: Make them clear, benefit-focused, and action-oriented.
Use social proof: Leverage testimonials, reviews, and trust badges.
Personalize experiences: Tailor messaging and offers to user behavior or traffic source.
Optimize for mobile: Ensure fast load times, easy-to-tap buttons, and mobile-friendly forms.
Create targeted landing pages: Align each campaign with a dedicated page for maximum relevance.


