
How to Use Cohort Analysis in DeFi: A Step-by-Step Guide

Key Takeaways
Cohort analysis groups wallets by a shared entry event such as a deposit, swap, or borrow, and tracks how that group behaves over time, revealing whether growth is durable in a way that aggregate dashboards like TVL and wallet count cannot.
Unlike time-series reporting, which shows total activity by date, cohort analysis distinguishes newer cohorts retaining better than older ones, organic users from incentive-driven mercenary capital that disappears once rewards end, and single-wallet users from high-value wallets whose activity is split across multiple addresses.
The five metrics that translate cohort data into growth decisions are D30 wallet retention rate, transaction frequency, cohort deposit volume, incentive-free retention rate, and cohort LTV by acquisition channel, all requiring wallet-level attribution tied to onchain events rather than page views or signups.
Six cohort types DeFi teams should track: acquisition (period of first transaction), channel (acquisition source), incentive (campaign participation), behavioural (first action taken), demographic (wallet age, net worth, country), and technographic (chain, device, OS), each mapped to a specific product or growth decision.
Effective cohort analysis treats blank cells in the retention matrix as pending data rather than churn, since a cohort's D60 or D90 numbers simply haven't matured yet, and the real signal comes from comparing the gap between incentive cohort retention and organic cohort retention at month 6, the clearest indicator of whether a campaign built a durable user base or just rented one.
Incentive campaigns inflate TVL and wallet counts. When rewards end, so does the activity. Aggregate dashboards show growth. Cohort analysis shows whether that growth is durable.
This cohort analysis guide is for DeFi product managers, growth leads, and founders who need to measure whether their user base is genuinely growing or inflated by incentives. It covers how to define cohorts for DeFi apps, build a retention matrix, and turn cohort patterns into product and growth decisions.
What this guide covers:
How cohort analysis differs from time-series reporting in DeFi, and why the entry event must be a meaningful action
Why traditional analytics setups produce misleading cohort data for onchain apps: transaction-based identity, incentive distortion, and multi-wallet behaviour
6 cohort types DeFi teams should track, including acquisition, channel, incentive, behavioural, demographic, and technographic, with entry logic and the decision each one informs
A step-by-step build sequence from entry event definition to retention matrix to lifecycle overlay
The metrics that translate cohort data into growth decisions, grounded in Formo’s docs and changelog
4 cohort patterns mapped to concrete product and growth actions
What is Cohort Analysis in DeFi?
What Cohort Analysis Actually Measures
Cohort analysis follows a group that shares one starting point and measures what that same group does later. It is not a total-wallet chart and it is not a list of users who happen to match a filter today. For example, every wallet that completed its first deposit in January is one cohort; its D7, D30, and D90 return rates show how that January group changed over time.
The method has three parts: choose a precise entry event, choose a meaningful return event, and compare groups at the same age. The shared start keeps the comparison fair. A cohort that is seven days old should be compared with other seven-day-old cohorts, not with the entire current user base.
A segment answers who matches a rule now, such as wallets that currently hold a position. A cohort answers how users who started together behaved afterward. Use segments to target or investigate a current group; use cohorts to learn whether a channel, onboarding path, or product change is improving return behavior.
A cohort is a group of users who share a defined starting point. Cohort analysis tracks what that group does next: how many return within 7 days, how many are still active at day 30, and how their deposit volume changes over 3 months.
The starting point matters. In DeFi, the right entry event is a first meaningful onchain action: a deposit, a swap, a borrow, or a first liquidity provision. A wallet that visited a page and left has not entered a cohort in any useful sense.
Differences between Cohort analysis and time-series reporting
Time-series charts show total activity by date: transactions per day, TVL over time, and daily active wallets. Cohort analysis shows how a defined group of users behaves over time from a shared starting point. The two answer different questions.
View | What it shows | What it misses |
Time-series | Total activity by date | Whether specific user groups are improving |
Cohort analysis | How a defined group behaves over time | Aggregate totals and real-time spikes |
A DeFi app can post record TVL in month 1 and near-zero organic retention by month 3. Time-series charts surface the divergence only after it has compounded. Cohort analysis surfaces it while there is still time to act.
Why DeFi Apps Need Cohort Analysis
1. Transactions are the unit of engagement
A wallet can visit a DeFi app daily without executing a single transaction. Retention in DeFi requires a return and a meaningful onchain action: adding liquidity, repaying a lending position, or executing a second swap. Cohorts built on page views measure traffic. Cohorts built on transactions measure engagement.
2. Incentives distort the baseline
Points programs, token rewards, and liquidity mining campaigns create cohorts that look healthy during the campaign and collapse immediately after. Aggregate retention rates during incentive periods reflect reward-seeking behaviour. The product retention signal only becomes visible after the campaign ends.
The pattern is consistent across DeFi: a cohort that entered during an active incentive period will show higher early deposit volume and lower long-term retention rates than a cohort that entered organically. Separating these two user segments is the core purpose of incentive cohort analysis.
Tracking behaviour after incentives end is where the real picture emerges, which is why structuring incentive programs around retention signals matters.
3. Multi-wallet identity inflates user counts
High-value DeFi users often operate multiple wallets simultaneously: one for stable yield, one for points farming, one for active positions. Single-wallet attribution counts each as a unique user, inflating cohort sizes and distorting per-user metrics like transaction frequency and deposit volume.
Challenge | Traditional apps | DeFi apps |
User identity | Email or device ID | Wallet address (1 user, multiple wallets possible) |
Entry event | Sign up or first login | First deposit, swap, borrow |
Retention signal | App open or session | App open, sessions, repeat transactions |
Distortion risk | Bot sign-ups | Incentive farming, multi-wallet splitting, bots |
Attribution layer | Cookie-based UTM | Referral codes, UTM, or referrer bound to the wallet at first connect |
Before building any cohort: define what counts as a user (a wallet that has executed at least 1 transaction), what counts as retained (a wallet that executes again within a defined window), and how you will handle multiple-wallet users. These definitions determine whether every downstream analysis is reliable.
Top Cohort Types for DeFi Apps
Cohort type | Grouping variable | Primary question answered | Best for |
Acquisition | Week or month of first transaction | Are newer users retaining better than older ones? | Measuring whether product improvements are translating into better retention over time |
Channel | Acquisition source (UTM, referral, click ID) | Which sources, channels, and campaigns bring users who return? | Budget allocation across acquisition channels |
Incentive | Whether the user first deposited during a campaign | Which incentives lead to long-term retention? Is retention real or reward-dependent? | Separating mercenary capital from genuine users |
Behavioural | First meaningful action taken | Which activation path leads to the highest retention and LTV? | Onboarding optimisation and habit loop design |
Demographic | Wallet age, net worth tier, or country | Do higher-value or more experienced wallets retain differently? | Identifying which user profiles are worth prioritising in acquisition and re-engagement |
Technographic | Chain, device, browser, or OS | Do users on specific chains or devices activate and retain at different rates? | Prioritising chain support and diagnosing platform-specific friction |
Acquisition cohorts
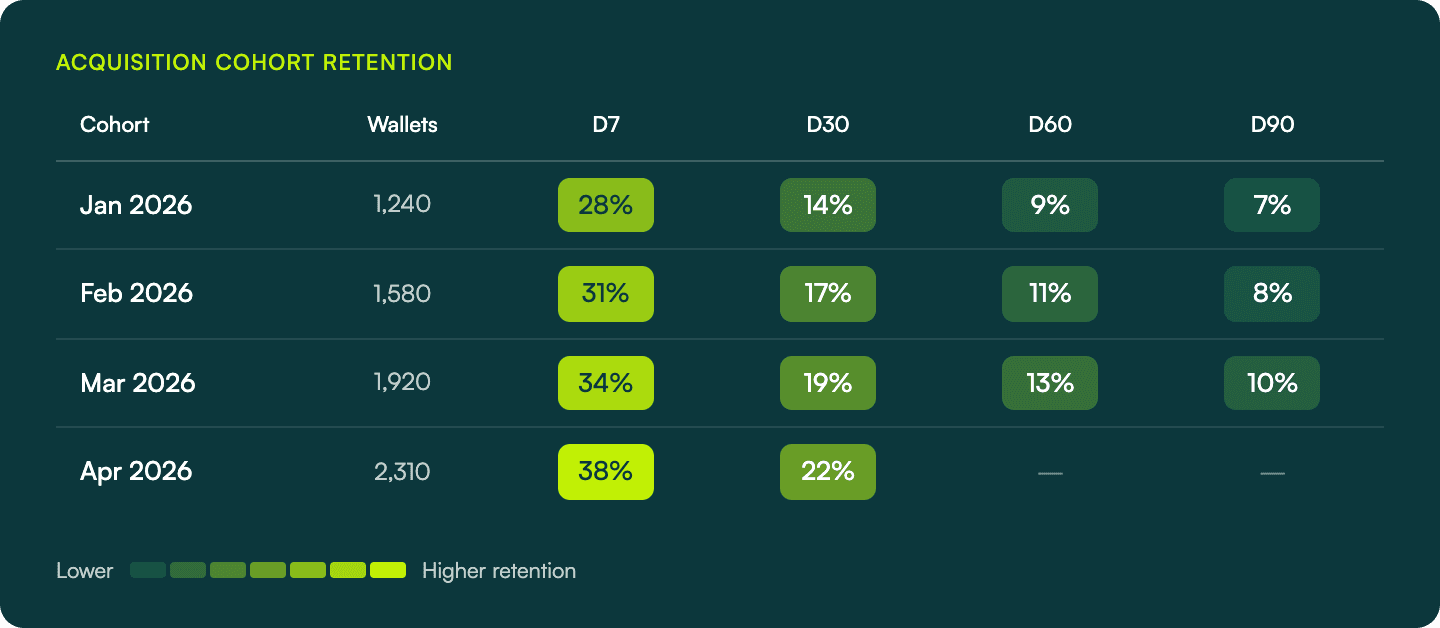
Acquisition cohorts group wallets by the period in which they first executed a transaction. Plotting D7, D30, and D90 retention across monthly cohorts shows whether product improvements are translating into better retention over time.
Formo’s Web SDK captures and persists attribution parameters (referral codes, referrers, and UTMs) and click IDs, connecting them to users and wallet addresses automatically.
How to read a retention matrix:
Read direction | What it tell you |
Across a row | How a single cohort decays over time |
Down a column | Whether newer cohorts retain better at the same interval |
Signals to watch:
Signal | Interpretation |
Rising D30 across successive cohorts | Product or onboarding changes are working |
Flat D30 across all cohorts | The retention constraint is in the product, not acquisition |
Falling D30 alongside rising wallet counts | Acquisition is outpacing product quality |
The Formo Retention docs describe this pattern directly: “Did a product change improve retention for newer cohorts? Is there seasonal variation in retention?” These are the questions acquisition cohorts answer.
Channel cohorts
Channel cohorts attach acquisition source data to wallet addresses and track retention by source. This helps you pinpoint which marketing channel or campaign is attracting the best quality users.
Formo’s channel metric assigns every session to exactly one of 12 channels at query time, using a priority-ordered classification ladder over referrer domain, utm_medium, and 8 ad-platform click IDs. No manual bucketing required.
The 12 channels Formo classifies:
Paid Search - paid signal + referrer is a search engine (Google, Bing, DuckDuckGo, Yahoo, Yandex, Baidu, and others)
Paid Video - paid signal + referrer is a video platform (YouTube, Vimeo, Twitch, Dailymotion)
Paid Social - paid signal + referrer is a social platform (Meta, X, LinkedIn, Reddit, TikTok, Pinterest, Snapchat, Threads, Discord, Telegram, Farcaster, and others)
Email -
utm_mediumset toemail,e-mail,e_mail, ornewsletterAffiliates -
utm_medium=affiliateor a non-emptyrefquery parameterDisplay -
utm_mediumset todisplay,banner,expandable, orinterstitialAI - referrer is an AI assistant domain (ChatGPT, Claude, Gemini, Copilot, Perplexity, DeepSeek, and others)
Organic Search -
utm_medium=organicor referrer is a search engine with no paid signalOrganic Social -
utm_mediumset tosocial,social-network,social-media, orsm, or referrer is a social platform with no paid signalOrganic Video - referrer is a video platform with no paid signal
Referrers - any other non-empty referrer not matched by the rules above
Direct - no referrer, no UTM, no click ID (typed URL, bookmark, or stripped referrer)
What to measure per channel:
D30 retention rate by channel, referrer, UTM source, or referral parameter
Deposit volume or protocol revenue per wallet, by channel
Cost per acquired wallet vs. cohort lifetime value, by channel
Incentive cohorts by campaign
If you’re running incentive campaigns, it’s important to measure their ROI and impact on retention.
You can do this by tagging all wallets that first executed a transaction during an active incentive period, then tracking their retention rate after the campaign ends. The incentives cohort type answers directly whether incentives are building a user base or renting one.
Formo automatically adds the Merkl Campaigns wallet label to profiled wallets. It detects participation in Merkl incentive campaigns by pulling campaign IDs directly from the Merkl API and storing them on each wallet profile. Teams can then filter users by campaign ID to measure the retention quality of wallets acquired through specific Merkl campaigns, without manual tagging.
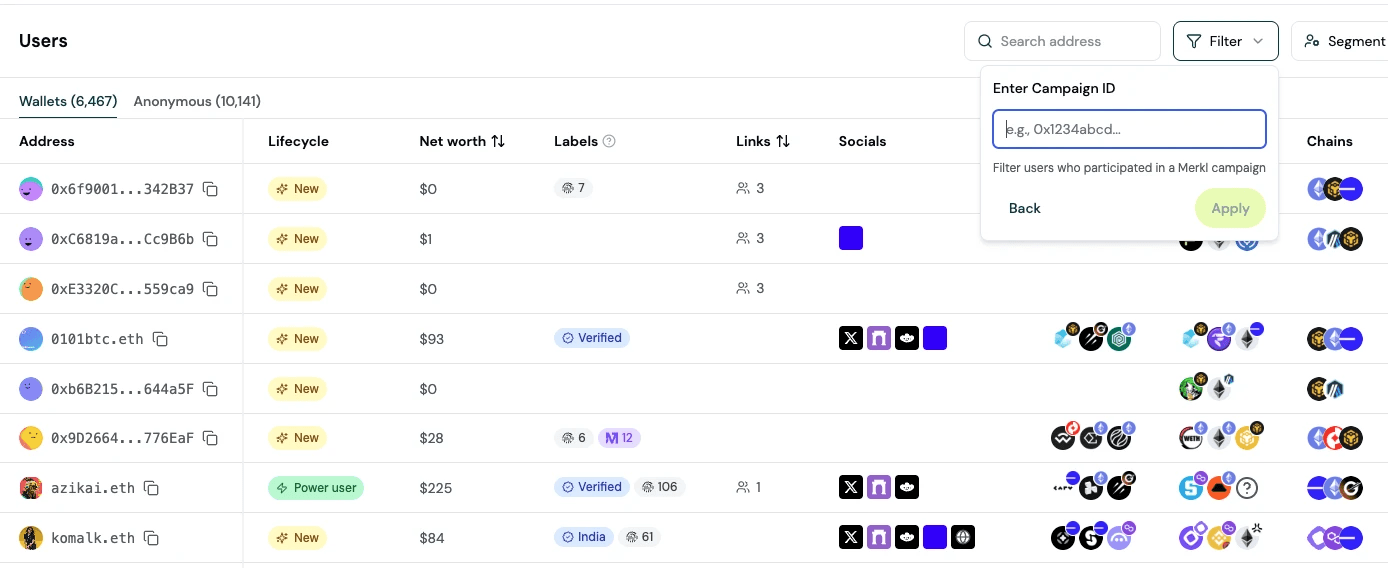
The gap between incentive cohort retention and organic cohort retention at month 6 is the clearest signal of whether an incentive program generated durable users or mercenary capital.
What to measure:
Signal | What it means |
Gradual post-incentive drop | Some users found genuine product value |
Cliff-shaped post-incentive drop | Users were optimising for rewards, not the product |
High deposit size for retained wallets | Incentive attracted quality users worth re-engaging |
Behavioural cohorts
Behavioural cohorts group wallets by the first meaningful action they took, then track how that action predicts long-term retention. Users who first deposited into a lending pool retain differently from users who first executed a swap.
Formo’s behaviour filters can anchor behaviour windows to each user’s first-seen timestamp. This lets teams ask questions like “who are the users who deposited within their first 24 hours?” or “how many users returned to execute a second transaction more than 7 days after they first arrived?”
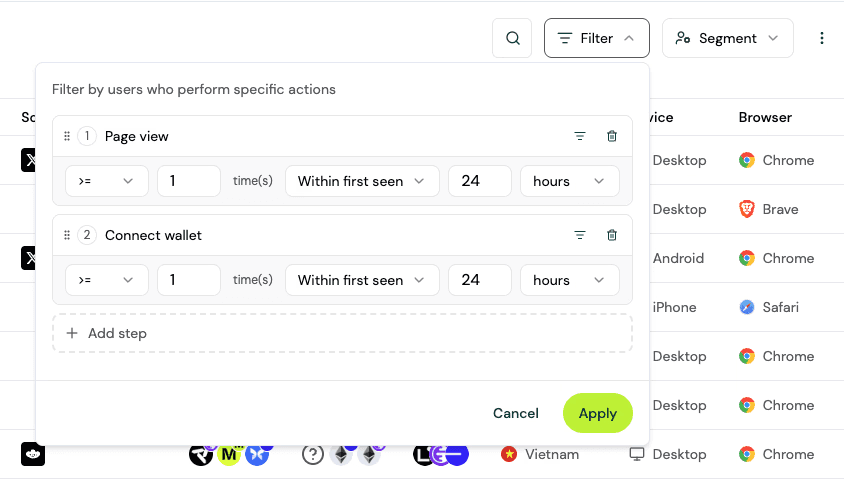
The Wallet Segmentation guide shows how to build these segments step by step.
What to measure:
Which first action (deposit, swap, LP add, borrow) correlates with the highest D30 retention
Whether a second transaction within 7 days of the first predicts higher D90 rates
Activation paths that correlate with higher average deposit size or transaction frequency
Demographic cohorts
Demographic cohorts group wallets by who the user is. In DeFi, the most actionable grouping variables are wallet age, net worth tier, device, and country.
These dimensions are available at the wallet level through Formo’s Audience Insights, which surfaces top apps, tokens, chains, net worth distribution, social profiles, and other information across your user base.
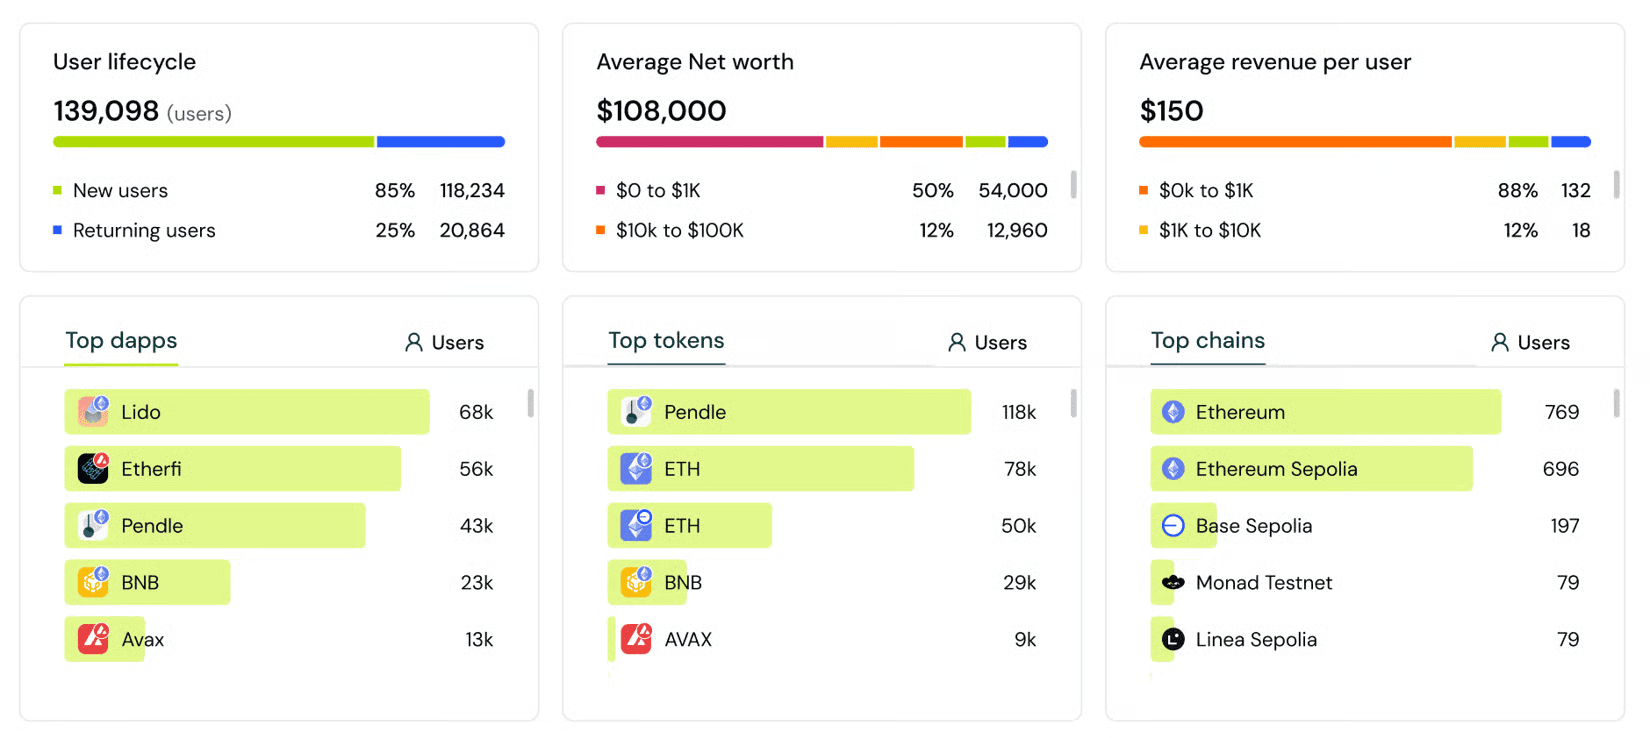
High net worth wallets tend to retain differently from newer wallets, shaped by their broader onchain experience and capital base. Demographic cohorts surface those differences, and help identify which user profiles are worth prioritising in acquisition and re-engagement.
What to measure:
D30 retention by wallet age, to identify whether more experienced wallets retain better
Activation rate by net worth tier, to understand whether higher-value wallets convert faster
Deposit volume per wallet by country, to surface where economically meaningful users are concentrated
Technographic cohorts
Technographic cohorts group wallets by the technical environment they operate in: chain (Ethereum mainnet, Arbitrum, Base, Solana), device, browser, or OS. In DeFi, the chain is the most actionable dimension because user profiles, liquidity depth, and fee expectations differ meaningfully across chains.
Base users and Arbitrum users often activate and retain at different rates, shaped by the liquidity depth, fee expectations, and user profiles of each ecosystem. Diagnosing those differences requires chain-level cohort splits.
Formo’s Mobile SDK extends technographic tracking to mobile, capturing device model, OS version, screen dimensions, and network type alongside onchain events for apps with a mobile surface.
What to measure:
D30 retention by chain, to identify whether a specific chain’s user base retains better
Activation rate by device or browser, to diagnose platform-specific friction in the onboarding funnel
Deposit volume per wallet by chain, to understand where economically meaningful users are concentrated
Step-by-Step Guide to Cohort Analysis for DeFi apps
The logic is the same whether you are running SQL against raw onchain data or using a unified analytics platform. The tooling changes; the sequence does not.
Step 1: Choose the cohort entry event
Write the definition down precisely before building anything. Changing the entry event mid-analysis invalidates historical comparisons. Use the entry event table in the previous section as a reference.
Example for a lending app:
“A user enters the cohort when they execute their first deposit transaction on the protocol. Wallet visits and connects before a deposit are excluded.”
Choosing an entry event for cohort analysis in DeFi
A wallet can visit a protocol, connect, and leave without any value moving. Cohorts built on visits include a population that was never meaningfully engaged.
Entry events by protocol type:
Protocol type | Entry event |
Lending / borrowing | First deposit or first borrow |
DEX | First swap executed |
Yield / vaults | First liquidity provision |
Bridge | First cross-chain transfer completed |
Perps / derivatives | First position opened |
Step 2: Define the retention event
The retention event is the action that counts as returning. For most DeFi apps, this is any subsequent transaction on the protocol within the measurement window.
For more nuanced analysis, define retention as a specific revenue-generating action: adding to an existing position, executing a second swap above a minimum size, or repaying a borrow.
Measurement windows to track:
Window | What it reveals |
D7 | Whether users return in the first week. High D7 with low D30 often points to habit failure after initial curiosity. |
D30 | The core retention signal for most DeFi apps. |
D60 and D90 | Whether retention is stabilising or continuing to decay. |
The Formo “Choose The Retention Event” is built around this principle. Retention is calculated from return events, so the data tracks re-engagement with the product rather than passive traffic. The docs recommend using a transaction as the retention event for crypto apps, because it shows who is using the protocol.
Step 3: Segment by cohort variable
Apply the cohort variable to the entry event data:
Cohort type | Segmentation variable |
Acquisition | Month or week of the entry event |
Channel | UTM source or referral parameter bound to the wallet at first connect |
Incentive | Boolean tag: did the wallet enter during an active campaign? |
Behaviour | Specific event type of the entry action |
Step 4: Build the retention matrix
A retention matrix plots cohort groups against time intervals and shows the percentage of each cohort still active at each point.
The table below is illustrative, showing the shape of a healthy DeFi cohort matrix where D30 improves across successive cohorts:
Cohort | D7 | D30 | D60 | D90 |
Jan 2026 | 28% | 14% | 9% | 7% |
Feb 2026 | 31% | 17% | 11% | 8% |
Mar 2026 | 34% | 19% | 13% | 10% |
Apr 2026 | 38% | 22% |
*Numbers above are illustrative only. They show the shape of an improving cohort matrix, not benchmarks for your app.
The Apr 2026 D60 and D90 cells are blank because those weeks have not yet matured. A blank cell means the data is pending. Formo’s “Read the Retention Matrix” renders still-maturing weeks as blank by default, removing the false churn cliff that appears when incomplete data is shown as zero.
The Formo Retention docs include benchmark ranges by app type:
App type | Week 1 | Week 4 | Week 8 |
DEX | 30-40% | 15-25% | 10-20% |
Lending | 25-35% | 15-20% | 10-15% |
Gaming | 35-50% | 20-30% | 15-25% |
*Benchmarks sourced from Retention benchmarks for crypto apps. Use as orientation, not targets.
Step 5: Include volume, revenue, and lifecycle data
Retention rates alone do not tell you which cohorts matter most economically. A cohort retaining at 15% but contributing 60% of protocol revenue is more valuable than one retaining at 40% on micro-transactions.
Overlay these dimensions onto the retention matrix:
Dimension | Where to find it in Formo |
Deposit volume per wallet | Volume and revenue timeseries on wallet profiles |
Protocol revenue per wallet | Profile page with full attribution of events, referrers, and UTMs |
Transaction frequency | Transaction frequency chart: distribution of transaction counts per wallet |
Lifecycle stage | Configurable lifecycle thresholds: New, Returning, Power user, At Risk, Churned, Resurrected |
Step 6: Identify the inflection point and act
Every cohort has an inflection point: the interval at which retention stabilises rather than continuing to decline. The residual retention rate after the inflection point represents the genuine user base. Growth strategy should be built around understanding what those users have in common and how to acquire more of them.
The following SQL query, from Formo’s churn prevention playbook, calculates month-over-month churn by cohort and runs directly in the SQL Explorer:
What counts as churn varies by app type. The Formo churn thresholds by app type:
App type | Churn threshold | Rationale |
DEX / Lending | 30+ days inactive | Long gaps between trades are normal; 30 days suggests abandonment |
Bridge / Cross-chain | 60+ days inactive | Multi-week cycles are normal; 60 days is the safety threshold |
Gaming | 14+ days inactive | Daily drivers; 2 weeks without a session signals churn |
The At Risk lifecycle stage in Formo flags previously engaged users whose activity has slowed before they fully churn. Together with Whale Detection Alert, your team can get notified when high-value wallets enter the At Risk stage, enabling a targeted intervention at the right moment.
Key Metrics That Matter For Cohort Analysis
Once the retention matrix is built, these 5 metrics translate raw cohort data into growth decisions.
Metric | Definition | Decision it drives |
D30 wallet retention rate | % of cohort wallets executing a transaction within 30 days of their first | Whether to prioritise retention or acquisition investment |
Transaction frequency | Distribution of transaction counts per wallet in the cohort | Onboarding and habit loop design |
Cohort deposit volume | Total and average deposit volume per wallet, by cohort | Which cohorts to prioritise for re-engagement |
Incentive-free retention rate | Retention rate measured during periods with no active incentive | Whether the product retains users on its own merits |
Cohort LTV by channel | Total protocol revenue or volume per wallet, by acquisition source | Budget allocation across acquisition channels |
D30 wallet retention rate
The percentage of wallets in a cohort that execute at least 1 transaction within 30 days of their first. This is the core retention signal for most DeFi apps.
A D30 rate that collapses immediately after a campaign ends signals incentive dependency. Reading this metric alongside TVL and volume gives a complete picture of protocol health.
Transaction frequency
The transaction frequency chart in Formo shows the distribution of transaction counts per wallet. A D30 retention rate of 20% means little if returning wallets only execute 1 additional transaction each.
Signal to watch: Cohorts where most wallets have exactly 1 transaction indicate the activation event is not creating a return habit. Diagnosing this at the funnel level reveals where the drop-off occurs.
Cohort deposit volume
Retention rate and economic contribution do not always move together. A cohort retaining at 15% but contributing 60% of protocol revenue is more valuable than one retaining at 40% on micro-transactions. Tracking cohort deposit volume alongside retention rate reveals which cohorts are worth re-engagement spend.
Formo’s volume and revenue timeseries on wallet profiles shows full attribution of which events, referrers, and UTMs contributed to volume and revenue for individual wallets.
Incentive-free retention rate
The retention rate measured during periods with no active incentive program shows whether the product holds users on its own. A persistent retention rate after a campaign ends confirms genuine product retention.
Cohort LTV by acquisition channel
Total protocol revenue or transaction volume per wallet, broken down by the channel that acquired the cohort. Connecting channel spend to onchain outcomes requires matching acquisition source data to conversion data such as volume, revenue, and retention. Customer lifetime value (LTV) is the metric that should drive growth and marketing decisions.
How to Make Decisions on Cohort Analysis Data
Cohort analysis is only useful if it changes what you do. These 4 decisions represent the highest-impact actions that fall out of a well-built DeFi cohort analysis.
Decision 1: Fix the activation path before scaling acquisition
When D7 retention is low across all cohorts, regardless of channel, the activation funnel is the constraint, not acquisition volume. Scaling spend before fixing activation compounds the waste.
How to diagnose the difference:
Pattern | Interpretation |
Different channels produce different D7 curves | Acquisition quality is the variable |
All channels produce the same flat D7 curve | Activation is the constraint |
Build a funnel from the landing page to the first transaction and identify where the largest drop occurs. Formo’s Funnels support last-touch attribution as a breakdown, so you can see which channel drove conversion at the moment of action. The compare mode lets you put 2 date ranges side by side to measure whether a funnel change improved conversion. Funnel segments let you filter any funnel by a saved segment to compare conversions across cohort groups.
The most common activation friction points in DeFi apps appear between wallet connect and the first transaction.
Decision 2: Reallocate budget away from low-LTV channels
Once channel cohorts are built, rank acquisition sources by D30 retention rate and cohort LTV. Reduce spend on channels where cohort LTV falls below your cost per acquired wallet. Increase spend on channels where LTV exceeds acquisition cost by a meaningful margin.
Ranking channels by cohort LTV against acquisition cost is the clearest basis for budget reallocation.
Decision 3: Restructure incentives around organic retention signals
When incentive cohort retention at month 6 falls materially below organic cohort retention, the incentive program20 is renting users. The response is to restructure incentives around actions that predict organic retention in your own cohort data.
2 concrete approaches:
If organic retained users consistently provide liquidity for longer than 30 days, design incentives that reward position duration rather than position size.
If organic retained users execute a second transaction within 7 days of their first, design onboarding incentives that reward that second action specifically.
Designing incentives around organic retention signals produces more durable user behaviour than rewarding position size alone.
Decision 4: Time re-engagement campaigns to the cohort drop-off window
Cohort analysis shows exactly when users drop off. The ‘At Risk lifecycle stage’ in Formo flags previously engaged users whose activity has slowed before they fully churn. ‘Formo Alerts’ can notify your team when high-value wallets enter the At Risk stage, enabling a targeted intervention before the wallet churns entirely.
Timing matters: A wallet that has executed a transaction but has not returned within 14 days has demonstrated intent. A targeted prompt at day 10 to 12 is more effective than a re-engagement campaign sent 60 days after last activity.
Final Takeaway
Cohort analysis tells you whether your DeFi app is retaining users or just accumulating wallet counts that look good on a dashboard. The teams that grow durably are the ones who measure which users came back, where they came from, and what they did when they first arrived. That is the data that drives decisions worth acting on.
How Formo Supports DeFi Cohort Analysis
Formo is the analytics and attribution platform built for DeFi apps. It combines product analytics, onchain attribution, and wallet intelligence in a single workflow, covering the full cohort analysis stack without requiring a custom data infrastructure.
Feature | What it does for cohort analysis |
Weekly AI-powered cohort analysis across acquisition quality, activation, revenue, and churn prediction. | |
Cohort retention matrix with configurable return events; still-maturing weeks render as blank rather than 0% | |
Anchor behaviour windows to each user’s first-seen timestamp. Ask questions like “users who deposited within their first 24 hours.” | |
Flags previously engaged wallets whose activity has slowed before full churn. Lifecycle thresholds are configurable per project. | |
Conversion funnel from landing page to first transaction, with last-touch attribution breakdown and segment filtering | |
Custom SQL queries against raw event data, with dynamic date variables and price oracle functions |
Get Started with Cohort Analysis
Cohort analysis groups users by a shared starting point and tracks how that group behaves over time. In DeFi, that means grouping by the first meaningful onchain action and measuring what share of each cohort returns at D7, D30, and D90. Aggregate metrics like TVL and wallet count hide whether growth is real or incentive-driven. Cohort analysis shows the difference.
Start by defining your entry event, build the retention matrix, then layer in volume, revenue, and lifecycle data to identify which cohorts are worth acting on. The teams that grow durably are the ones who know which channels, activation paths, and incentive structures produce users who stay.
Frequently Asked Questions
What is cohort analysis in DeFi?
Cohort analysis groups wallets by a shared starting point, such as the week they first deposited or the campaign that acquired them, and tracks how that group behaves over time. It shows whether specific user groups are retaining, growing in value, or dropping off, which aggregate dashboards cannot reveal.
What do teams use cohort analysis for?
DeFi growth teams use cohort analysis to answer 4 core questions: whether newer users are retaining better than older ones, which acquisition channels bring users who return, whether incentive programs are building a durable user base or renting one, and which activation paths lead to the strongest long-term retention. The output is a specific product or growth decision.
What is the difference between a segment and a cohort?
A segment is a group of users who share a characteristic at a given point in time, such as all wallets currently holding more than $10,000 in a lending pool. A cohort is a group of users who shared a starting point at a specific moment in time, such as all wallets that made their first deposit in January. Segments are static snapshots. Cohorts track how a defined group changes over time from that starting point.
What makes a good cohort entry event?
The entry event should be the first meaningful action on your app. For a lending app, that is a first deposit. For a DEX, it is the first swap executed. For a yield vault, it is a first liquidity provision. A wallet that loaded the interface without completing a transaction has not entered a cohort in any analytically useful sense.
How is cohort analysis different from time-series reporting?
Time-series charts show total activity across all users at a given date: transactions per day, TVL over time, and daily active wallets. Cohort analysis shows how a defined group of wallets behaves from a shared starting point. A DeFi app can show record TVL in month 1 and near-zero organic retention rates by month 3. Time-series charts show divergence after it has compounded. Cohort analysis surfaces it while there is still time to act.
Which cohort types matter most in DeFi?
The 4 most actionable cohort types are acquisition cohorts (are newer users retaining better?), channel cohorts (which sources bring users who return?), incentive cohorts (is retention real or reward-dependent?), and behavioural cohorts (which activation path leads to the highest retention?). Demographic and technographic cohorts add further depth when wallet-level and chain-level data are available.
How can incentives distort cohort analysis?
Wallets that enter during an active points program, token reward, or liquidity mining campaign behave differently from wallets that enter organically. Incentive cohorts tend to show higher early deposit volume and lower long-term retention rates. The product retention signal becomes visible after the campaign ends. Separating incentive cohorts from organic cohorts is the clearest way to measure whether an incentive program built a user base or rented one.
What should count as a retention event in DeFi?
The retention event is the action that counts as returning. For most DeFi apps, this is any subsequent transaction on the protocol within the measurement window. For more precise analysis, define retention as a specific revenue-generating action: adding to an existing position, executing a second swap above a minimum size, or repaying a borrow.
What should teams measure inside each cohort?
The 5 most useful metrics are D30 wallet retention rate (the core retention signal), transaction frequency (distinguishes one-time users from repeat users), cohort deposit volume (shows which cohorts contribute the most value), incentive-free retention rate (shows whether the product retains users on its own), and cohort LTV by acquisition channel (the metric that should drive budget allocation).


